Note
Go to the end to download the full example code. or to run this example in your browser via Binder
SearchLight with a custom correlation estimator
This example shows how to use SearchLight
with a user-defined
scikit-learn compatible estimator.
As in many other examples, we fetch the Haxby dataset using
fetch_haxby
and compare two of the visual task categories: “face” and “house” images.
The example is divided into the following sections:
Load the dataset and keep only
faceandhousetrials.Define a custom
CorrelationMVPAestimator (following Haxby et al.[1]) that computes the correlation contrast as(within-category similarity - between-category similarity) / 2across run splits.Run a whole-brain SearchLight analysis with this estimator.
Visualize the resulting correlation-score map.
Load Haxby dataset
For a complete picture of this dataset, please refer to the dataset description.
import numpy as np
import pandas as pd

from nilearn.datasets import fetch_haxby

# We fetch one subject from Haxby dataset (the default argument)
haxby_dataset = fetch_haxby()

# Print basic information on the dataset
print(f"Functional nifti image (4D) is located at: {haxby_dataset.func[0]}")

fmri_filename = haxby_dataset.func[0]

labels = pd.read_csv(haxby_dataset.session_target[0], sep=" ")
y = labels["labels"]
run = labels["chunks"]
[wrapper] Dataset directory found: /home/runner/work/nilearn/nilearn/nilearn_data/haxby2001
Functional nifti image (4D) is located at: /home/runner/work/nilearn/nilearn/nilearn_data/haxby2001/subj2/bold.nii.gz
Restrict to faces and houses
from nilearn.image import index_img

condition_mask = y.isin(["face", "house"])

fmri_img = index_img(fmri_filename, condition_mask)
y, run = y[condition_mask], run[condition_mask]

# Overview of the input data
n_labels = len(np.unique(y))

print(f"{n_labels} labels (`y`): {np.unique(y)}")
print(f"fMRI data shape (`X`): {fmri_img.shape}")
print(f"Runs (`groups`): {np.unique(run)}")
2 labels (`y`): ['face' 'house']
fMRI data shape (`X`): (40, 64, 64, 216)
Runs (`groups`): [ 0  1  2  3  4  5  6  7  8  9 10 11]
Define our own MVPA estimator for use in SearchLight
We now define a custom Multi-Voxel Pattern Analysis (MVPA) estimator to compute within each SearchLight. In this case, we use the Haxby-style correlation contrast as defined in Haxby et al.[1].
from sklearn.base import BaseEstimator


def fisher_z(r, eps=1e-12):
    """Apply Fisher z-transform to correlation coefficient r."""
    # clip to avoid inf at ±1
    r = np.clip(r, -1 + eps, 1 - eps)
    return np.arctanh(r)


def pattern_corr(a, b):
    """
    Compute correlation between two patterns, with mean-centering and norm.

    This is a more stable and efficient way to compute correlation than
    np.corrcoef for 1D patterns.
    """
    a = a - a.mean()
    b = b - b.mean()
    denom = (np.linalg.norm(a) * np.linalg.norm(b)) + 1e-12
    return float(np.dot(a, b) / denom)


class CorrelationMVPA(BaseEstimator):
    """
    Haxby-style correlation Multi-Voxel Pattern Analysis (MVPA)
    score for a pair of labels.

    Computes
    `(within-category similarity - between-category similarity) / 2`
    using run splits.

    Parameters
    ----------
    labels : tuple of str, default=("face", "house")
        The two condition labels to contrast. Must be present in `y`.
    """

    nilearn_searchlight_uses_cv = False

    def __init__(self, labels=("face", "house")):
        self.labels = labels

    def fit(self, X, y, groups=None):
        """
        Fit the estimator and store a single correlation-based score.

        Parameters
        ----------
        X : ndarray of shape (n_samples, n_features)
            Input data matrix for one SearchLight sphere. Rows are samples
            (volumes) and columns are voxel features in the sphere.

        y : array-like of shape (n_samples,)
            Condition labels for each sample. Must contain both labels
            specified in ``self.labels``.

        groups : array-like of shape (n_samples,), default=None
            Run/chunk assignment per sample. Required to create two splits
            (currently parity-based: even runs vs odd runs).

        Returns
        -------
        self : CorrelationMVPA
            Fitted estimator with ``score_`` set to the MVPA contrast.
            If any required condition/split combination is missing,
            ``score_`` is set to ``NaN``.
        """
        if groups is None:
            raise ValueError(
                "``groups`` (e.g., runs) are required for CorrelationMVPA."
            )

        a, b = self.labels
        y = np.asarray(y)
        groups = np.asarray(groups)

        # Create two splits based on parity (i.e., even vs. odd)
        g1 = groups % 2 == 0
        g2 = ~g1

        def mean_pattern(lbl, mask):
            """Compute the mean pattern within a mask for a given label."""
            sel = (y == lbl) & mask
            if not np.any(sel):
                return None
            return X[sel].mean(axis=0)

        a1 = mean_pattern(a, g1)
        a2 = mean_pattern(a, g2)
        b1 = mean_pattern(b, g1)
        b2 = mean_pattern(b, g2)
        if any(v is None for v in (a1, a2, b1, b2)):
            self.score_ = float("nan")
            return self

        r_aa = pattern_corr(a1, a2)
        r_bb = pattern_corr(b1, b2)
        r_ab = pattern_corr(a1, b2)
        r_ba = pattern_corr(b1, a2)

        r_aa, r_bb, r_ab, r_ba = map(fisher_z, (r_aa, r_bb, r_ab, r_ba))

        self.score_ = 0.5 * ((r_aa + r_bb) - (r_ab + r_ba))
        return self

    def score(self, X, y=None, groups=None):
        """
        Return the score computed during fitting.

        Parameters
        ----------
        X, y, groups : ignored
             These parameters are required by the sklearn API but are not used
             here since the score is pre-computed in fit.
        """
        # SearchLight can call this after fit
        del X, y, groups  # unused, required by sklearn API
        return self.score_
Perform searchlight analysis
Using the CorrelationMVPA estimator defined above,
we perform a Searchlight analysis.
We compute and provide a binary mask using
compute_epi_mask to restrict
the Searchlight and reduce the computational time.
from nilearn.decoding import SearchLight
from nilearn.masking import compute_epi_mask

mask_img = compute_epi_mask(fmri_img)

searchlight = SearchLight(
    mask_img=mask_img,
    process_mask_img=mask_img,
    radius=5.6,
    n_jobs=2,
    estimator=CorrelationMVPA(labels=("face", "house")),
)
searchlight.fit(imgs=fmri_img, y=y, groups=run)
scores_img = searchlight.scores_img_
/home/runner/work/nilearn/nilearn/examples/07_advanced/plot_haxby_mvpa.py:216: UserWarning:

Use a custom estimator at your own risk of the process not working as intended.
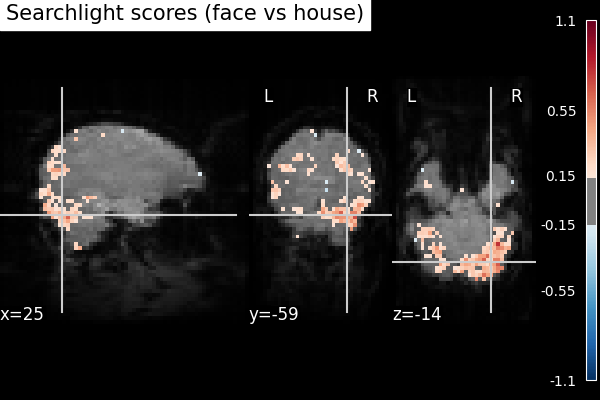
Visualize the searchlight scores
We can now visualize the Searchlight scores calculated
using our custom CorrelationMVPA.
from matplotlib import pyplot as plt

from nilearn.image import mean_img
from nilearn.plotting import plot_stat_map, show

mean_fmri = mean_img(fmri_img)

plot_stat_map(
    scores_img,
    bg_img=mean_fmri,
    title="Searchlight scores (face vs house)",
    threshold=0.15,
    vmax=1.0,
    black_bg=True,
    figure=plt.figure(figsize=(6, 4)),
    symmetric_cbar=True,
)

show()
References
Total running time of the script: (0 minutes 32.911 seconds)
Estimated memory usage: 1052 MB
