Note
Go to the end to download the full example code. or to run this example in your browser via Binder
Region Extraction using a t-statistical map (3D)
This example shows how to extract regions or separate the regions from a statistical map.
We use localizer t-statistic maps from
fetch_neurovault_auditory_computation_task
as an input image.
The idea is to threshold an image to get foreground objects using a
function threshold_img and
extract objects using a function
connected_regions.
Fetching t-statistic image of localizer contrasts by loading from datasets utilities
from nilearn.datasets import fetch_neurovault_auditory_computation_task

localizer = fetch_neurovault_auditory_computation_task(timeout=30.0)
tmap_filename = localizer.images[0]
[fetch_neurovault_auditory_computation_task] Dataset directory found:
/home/runner/work/nilearn/nilearn/nilearn_data/neurovault
Threshold the t-statistic image by importing threshold function
from nilearn.image import threshold_img
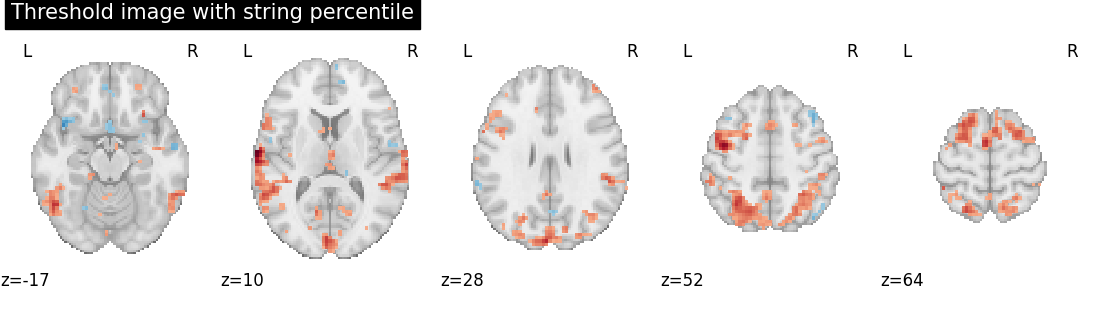
# Two types of strategies can be used from this threshold function
# Type 1: strategy used will be based on scoreatpercentile
threshold_percentile_img = threshold_img(
tmap_filename, threshold="97%", copy=False
)
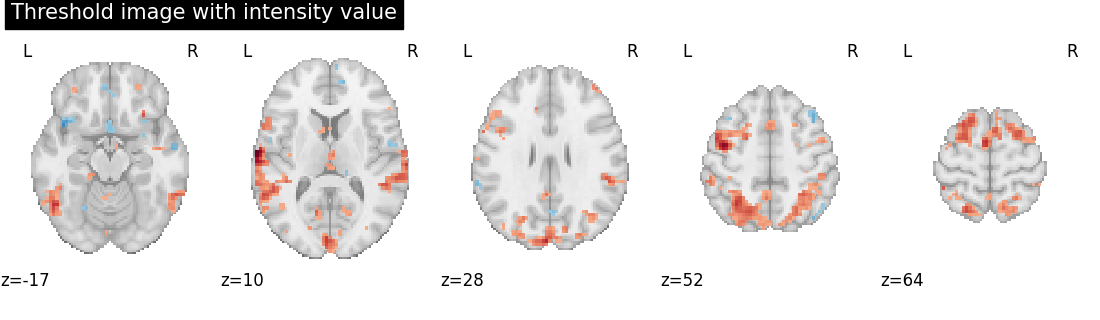
# Type 2: threshold strategy used will be based on image intensity
# Here, threshold value should be within the limits i.e. less than max value.
threshold_value_img = threshold_img(tmap_filename, threshold=3.0, copy=False)
Visualization Showing thresholding results by importing plotting modules and its utilities
from nilearn.plotting import plot_stat_map, show

# Showing percentile threshold image
plot_stat_map(
    threshold_percentile_img,
    display_mode="z",
    cut_coords=5,
    title="Threshold image with string percentile",
    colorbar=False,
)

# Showing intensity threshold image
plot_stat_map(
    threshold_value_img,
    display_mode="z",
    cut_coords=5,
    title="Threshold image with intensity value",
    colorbar=False,
)

show()
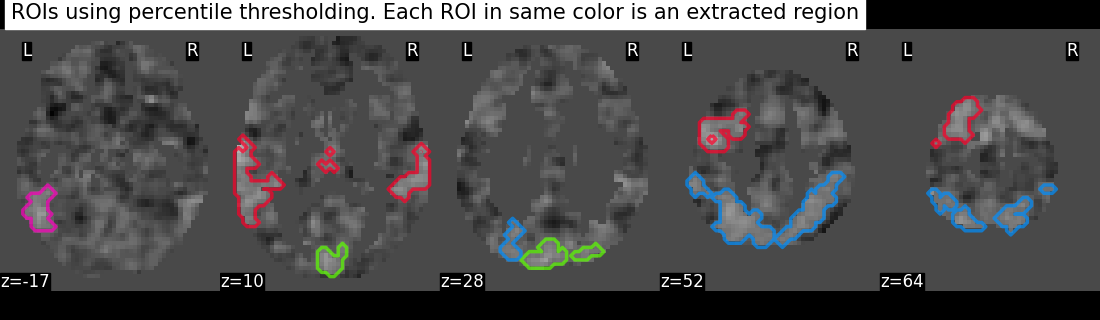
Extracting the regions by importing connected regions function
from nilearn.regions import connected_regions
regions_percentile_img, index = connected_regions(
threshold_percentile_img, min_region_size=1500
)
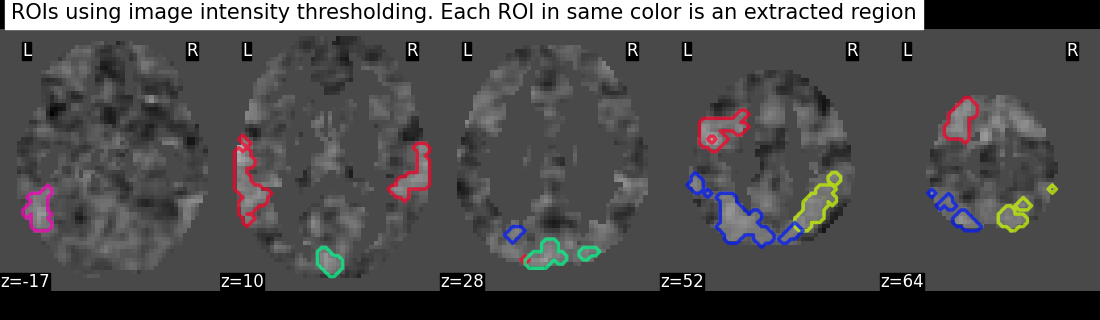
regions_value_img, index = connected_regions(
threshold_value_img, min_region_size=1500
)
Visualizing region extraction results
from nilearn.plotting import plot_prob_atlas

images = [regions_percentile_img, regions_value_img]
for image, strategy in zip(
    images, ["percentile", "image intensity"], strict=False
):
    title = (
        f"ROIs using {strategy} thresholding. "
        "Each ROI in same color is an extracted region"
    )
    plot_prob_atlas(
        image,
        bg_img=tmap_filename,
        view_type="contours",
        display_mode="z",
        cut_coords=5,
        title=title,
    )
show()
Total running time of the script: (0 minutes 3.499 seconds)
Estimated memory usage: 131 MB