Note
This page is a reference documentation. It only explains the function signature, and not how to use it. Please refer to the user guide for the big picture.
nilearn.plotting.plot_carpet
- nilearn.plotting.plot_carpet(img, mask_img=None, mask_labels=None, t_r=None, detrend=True, output_file=None, figure=None, axes=None, vmin=None, vmax=None, title=None, cmap='gray', cmap_labels='gist_ncar', standardize=True)[source]
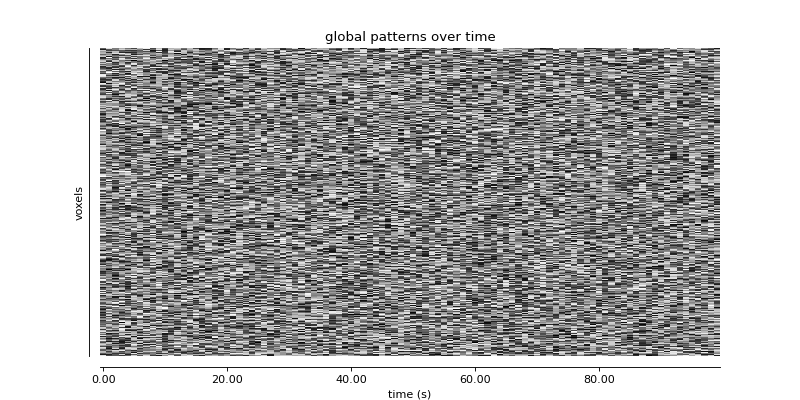
Plot an image representation of voxel intensities across time.
This figure is also known as a “grayplot” or “Power plot”.
- Parameters:
- imgNiimg-like object
See Input and output: neuroimaging data representation. 4D image.
- mask_imgNiimg-like object or None, default=None
Limit plotted voxels to those inside the provided mask. If a 3D atlas is provided, voxels will be grouped by atlas value and a colorbar will be added to the left side of the figure with atlas labels. If not specified, a new mask will be derived from data. See Input and output: neuroimaging data representation.
- mask_labels
dictor None, default=None If
mask_imgcorresponds to an atlas, then this dictionary maps values from themask_imgto labels. Dictionary keys are labels and values are values within the atlas.- t_r
floatorintor None, default=None Repetition time, in seconds (sampling period). Set to None if not provided.
Note
If
t_ris not provided, it will be inferred fromimg’s header (img.header.get_zooms()[-1]).Added in Nilearn 0.9.1: Prior to this,
t_rwould be inferred fromimgwithout user input.- detrend
bool, default=True Detrend and z-score the data prior to plotting.
- output_file
strorpathlib.Pathor None, default=None The name of an image file to export the plot to. Valid extensions are .png, .pdf, .svg. If output_file is not None, the plot is saved to a file, and the display is closed.
- figure
int, ormatplotlib.figure.Figure, or None, optional Matplotlib figure used or its number. If None is given, a new figure is created.
- axes
matplotlib.axes.Axes, or 4tupleoffloat: (xmin, ymin, width, height), default=None The axes, or the coordinates, in matplotlib figure space, of the axes used to display the plot. If None, the complete figure is used.
- vmin
floator obj:int or None, optional Lower bound of the colormap. The values below vmin are masked. If None, the min of the image is used. Passed to
matplotlib.pyplot.imshow.- vmax
floator obj:int or None, optional Upper bound of the colormap. The values above vmax are masked. If None, the max of the image is used. Passed to
matplotlib.pyplot.imshow.- title
str, or None, default=None The title displayed on the figure.
- cmap
matplotlib.colors.Colormap, orstr, optional The colormap to use. Either a string which is a name of a matplotlib colormap, or a matplotlib colormap object. default=`gray`.
- cmap_labels
matplotlib.colors.Colormap, orstr, default=`gist_ncar` If
mask_imgcorresponds to an atlas, then cmap_labels can be used to define the colormap for coloring the labels placed on the side of the carpet plot.- standardizeany of: ‘zscore_sample’, ‘zscore’, ‘psc’, True, False or None; default=True
Strategy to standardize the signal:
'zscore_sample': The signal is z-scored. Timeseries are shifted to zero mean and scaled to unit variance. Uses sample std.'psc': Timeseries are shifted to zero mean value and scaled to percent signal change (as compared to original mean signal).True: The signal is z-scored (same as option zscore). Timeseries are shifted to zero mean and scaled to unit variance.Deprecated since Nilearn 0.13.0: In nilearn version 0.15.0,
Truewill be replaced by'zscore_sample'.False: Do not standardize the data.Deprecated since Nilearn 0.13.0: In nilearn version 0.15.0,
Falsewill be replaced byNone.
Deprecated since Nilearn 0.13.0: The default will be changed to
'zscore_sample'in version 0.15.0.Note
Added to control passing value to standardize of
signal.cleanto call new behavior since passing False or True (default) is deprecated. This parameter will be removed in version 0.15.
- Returns:
- figure
matplotlib.figure.Figure Figure object with carpet plot.
- figure
Notes
This figure was originally developed in Power[1].
In cases of long acquisitions (>800 volumes), the data will be downsampled to have fewer than 800 volumes before being plotted.
References
Examples
>>> from nilearn.plotting import plot_carpet, show
>>> from nibabel import Nifti1Image
>>> import numpy as np
>>>
>>> rng = np.random.default_rng(seed=42)
>>> data = rng.integers(low=0, high=100,
...                     size=(12, 12, 12, 100), dtype=np.int32)
>>> mask = np.ones((12, 12, 12), dtype=bool)
>>> img = Nifti1Image(data, affine=np.eye(4))
>>> mask_img = Nifti1Image(mask.astype(np.int8), affine=np.eye(4))
>>>
>>> display = plot_carpet(
...     img,
...     mask_img=mask_img,
...     title="global patterns over time",
... )
>>>
>>> show()