Note
This page is a reference documentation. It only explains the function signature, and not how to use it. Please refer to the user guide for the big picture.
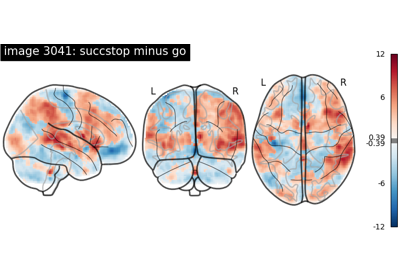
nilearn.plotting.plot_glass_brain
- nilearn.plotting.plot_glass_brain(stat_map_img, output_file=None, display_mode='ortho', colorbar=True, cbar_tick_format='%.2g', figure=None, axes=None, title=None, threshold='auto', annotate=True, black_bg=False, cmap=None, alpha=0.7, vmin=None, vmax=None, plot_abs=True, symmetric_cbar='auto', resampling_interpolation='continuous', radiological=False, transparency=None, **kwargs)[source]
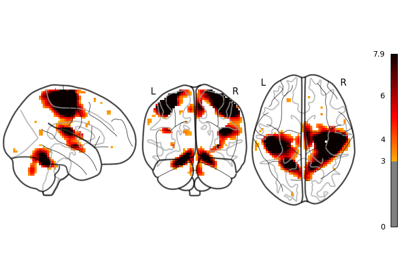
Plot 2d projections of an ROI/mask image (by default 3 projections: Frontal, Axial, and Lateral). The brain glass schematics are added on top of the image.
The plotted image should be in MNI space for this function to work properly.
Only glass brain can be plotted by switching stat_map_img to None.
- Parameters:
- stat_map_imgNiimg-like object
See Input and output: neuroimaging data representation. The statistical map image. It needs to be in MNI space in order to align with the brain schematics.
- output_file
strorpathlib.Pathor None, default=None The name of an image file to export the plot to. Valid extensions are .png, .pdf, .svg. If output_file is not None, the plot is saved to a file, and the display is closed.
- display_mode
str, default=’ortho’ Choose the direction of the cuts: ‘x’ - sagittal, ‘y’ - coronal, ‘z’ - axial, ‘l’ - sagittal left hemisphere only, ‘r’ - sagittal right hemisphere only, ‘ortho’ - three cuts are performed in orthogonal directions. Possible values are: ‘ortho’, ‘x’, ‘y’, ‘z’, ‘xz’, ‘yx’, ‘yz’, ‘l’, ‘r’, ‘lr’, ‘lzr’, ‘lyr’, ‘lzry’, ‘lyrz’.
- colorbar
bool, optional If True, display a colorbar next to the plots. default=True.
- cbar_tick_format
str, default=”%.2g” (scientific notation) Controls how to format the tick labels of the colorbar. Ex: use “%i” to display as integers.
- figure
int, ormatplotlib.figure.Figure, or None, optional Matplotlib figure used or its number. If None is given, a new figure is created.
- axes
matplotlib.axes.Axes, or 4tupleoffloat: (xmin, ymin, width, height), default=None The axes, or the coordinates, in matplotlib figure space, of the axes used to display the plot. If None, the complete figure is used.
- title
str, or None, default=None The title displayed on the figure.
- threshold
intorfloat,str, None, or ‘auto’, optional If None is given, the image is not thresholded. If number is given, it must be non-negative. The specified value is used to threshold the image: values below the threshold (in absolute value) are plotted as transparent. If a string percentile is given, it should finish with percent sign e.g., “95%”. We threshold based on the score obtained using this percentile on the image data. If “auto” is given, the threshold is determined based on the score obtained using percentile value “80%” on the absolute value of the image data. default=’auto’.
- annotate
bool, default=True If annotate is True (like positions and / or left/right annotation) are added to the plot.
- black_bg
bool, or “auto”, optional If True, the background of the image is set to be black. If you wish to save figures with a black background, you will need to pass facecolor=”k”, edgecolor=”k” to
matplotlib.pyplot.savefig. default=False.- cmap
matplotlib.colors.Colormap, orstr, optional The colormap to use. Either a string which is a name of a matplotlib colormap, or a matplotlib colormap object. default=None.
- alpha
floatbetween 0 and 1, default=0.7 Alpha transparency for the brain schematics.
- vmin
floator obj:int or None, optional Lower bound of the colormap. The values below vmin are masked. If None, the min of the image is used. Passed to
matplotlib.pyplot.imshow.- vmax
floator obj:int or None, optional Upper bound of the colormap. The values above vmax are masked. If None, the max of the image is used. Passed to
matplotlib.pyplot.imshow.- plot_abs
bool, default=True If set to True maximum intensity projection of the absolute value will be used (rendering positive and negative values in the same manner). If set to false the sign of the maximum intensity will be represented with different colors. See Glass brain plotting in nilearn (all options) for examples.
- symmetric_cbar
bool, or “auto”, default=”auto” Specifies whether the colorbar and colormap should range from -vmax to vmax (or from vmin to -vmin if -vmin is greater than vmax) or from vmin to vmax. Setting to “auto” (the default) will select the former if either vmin or vmax is None and the image has both positive and negative values.
- resampling_interpolation
str, optional Interpolation to use when resampling the image to the destination space. Can be:
"continuous": use 3rd-order spline interpolation"nearest": use nearest-neighbor mapping.
Note
"nearest"is faster but can be noisier in some cases.default=’continuous’.
- radiological
bool, default=False Invert x axis and R L labels to plot sections as a radiological view. If False (default), the left hemisphere is on the left of a coronal image. If True, left hemisphere is on the right.
- transparency
floatbetween 0 and 1, or a Niimg-Like object, or None, default = None Value to be passed as alpha value to
imshow. ifNoneis passed, it will be set to 1. If an image is passed, voxel-wise alpha blending will be applied, by relying on the absolute value oftransparencyat each voxel.Added in Nilearn 0.12.0.
- transparency_range
tupleorlistof 2 non-negative numbers, or None, default = None When an image is passed to
transparency, this determines the range of values in the image to use for transparency (alpha blending). For example withtransparency_range = [1.96, 3], any voxel / vertex ( ):
):with a value between between -1.96 and 1.96, would be fully transparent (alpha = 0),
with a value less than -3 or greater than 3, would be fully opaque (alpha = 1),
with a value in the intervals
[-3.0, -1.96]or[1.96, 3.0], would have an alpha_i value scaled linearly between 0 and 1 : .
.
This parameter will be ignored unless an image is passed as
transparency. The first number must be greater than 0 and less than the second one. ifNoneis passed, this will be set to[0, max(abs(transparency))].Added in Nilearn 0.12.0.
- kwargsextra keyword arguments, optional
Extra keyword arguments ultimately passed to matplotlib.pyplot.imshow via
add_overlay.
- Returns:
- display
OrthoProjector An instance of the OrthoProjector class.
- display
- Raises:
- ValueError
if the specified threshold is a negative number
Notes
Arrays should be passed in numpy convention: (x, y, z) ordered.
Examples using nilearn.plotting.plot_glass_brain

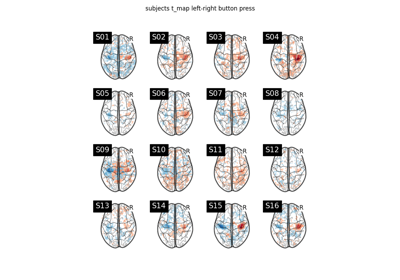
First level analysis of a complete BIDS dataset from openneuro
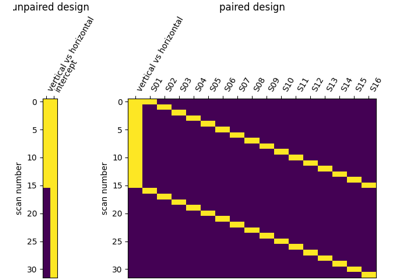
Second-level fMRI model: two-sample test, unpaired and paired
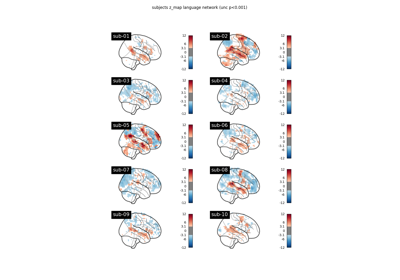
Massively univariate analysis of a motor task from the Localizer dataset
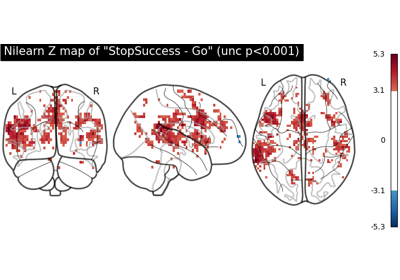
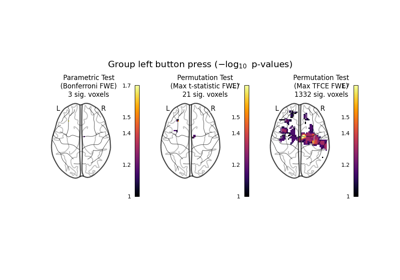
NeuroVault meta-analysis of stop-go paradigm studies