Note
Go to the end to download the full example code. or to run this example in your browser via Binder
Second-level fMRI model: two-sample test, unpaired and paired
Full step-by-step example of fitting a GLM to perform a second level analysis in experimental data and visualizing the results
More specifically:
A list of subject-level fMRI contrasts is downloaded.
2. An unpaired, two-sample t-test is applied to the brain maps in order to see the effect of the contrast difference across subjects.
3. A paired, two-sample t-test is applied to the brain maps in order to see the effect of the contrast difference across subjects, considering subject intercepts
dataset
This example uses contrasts for responses to retinotopically distinct vertical versus horizontal checkerboards from the Brainomics Localizer dataset.
At the individual level, these stimuli are sometimes used to map the borders of primary visual areas. At the group level, such a mapping is not possible. Yet, we may observe some significant effects in these areas.
import pandas as pd

from nilearn.datasets import fetch_localizer_contrasts
from nilearn.plotting import plot_design_matrix, plot_glass_brain, show
Fetch dataset
We download the first-level contrasts from a 16 subjects.
n_subjects = 16
sample_vertical = fetch_localizer_contrasts(
    ["vertical checkerboard"],
    n_subjects,
)
sample_horizontal = fetch_localizer_contrasts(
    ["horizontal checkerboard"],
    n_subjects,
)

# Implicitly, there is a one-to-one correspondence between the two samples:
# the first image of both samples comes from subject S1,
# the second from subject S2 etc.
[fetch_localizer_contrasts] Dataset directory found: /home/runner/work/nilearn/nilearn/nilearn_data/brainomics_localizer
[fetch_localizer_contrasts] Dataset directory found: /home/runner/work/nilearn/nilearn/nilearn_data/brainomics_localizer
Estimate second level models
We define the input maps and the design matrix for the second level model and fit it.
second_level_input = sample_vertical["cmaps"] + sample_horizontal["cmaps"]
Next, we model the effect of conditions (sample 1 vs sample 2).
import numpy as np

condition_effect = np.hstack(([1] * n_subjects, [0] * n_subjects))
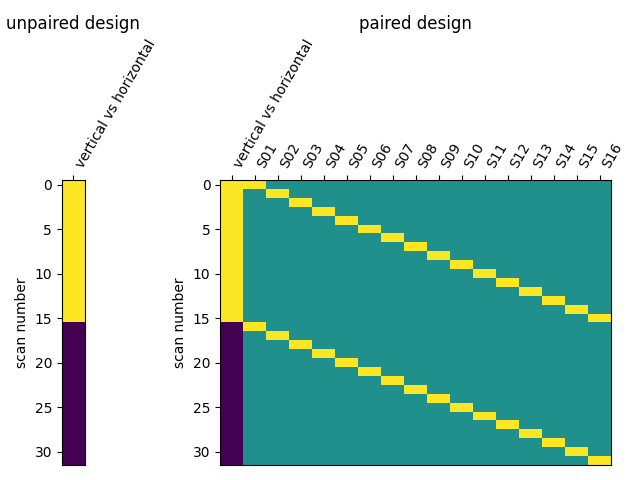
The design matrix for the unpaired test needs to add an intercept, For the paired test, we include an intercept for each subject.
subject_effect = np.vstack((np.eye(n_subjects), np.eye(n_subjects)))
subjects = [f"S{i:02d}" for i in range(1, n_subjects + 1)]
We then assemble those into design matrices
unpaired_design_matrix = pd.DataFrame(
    {
        "vertical vs horizontal": condition_effect,
        "intercept": 1,
    }
)

paired_design_matrix = pd.DataFrame(
    np.hstack((condition_effect[:, np.newaxis], subject_effect)),
    columns=["vertical vs horizontal", *subjects],
)
and plot the designs.
import matplotlib.pyplot as plt

_, (ax_unpaired, ax_paired) = plt.subplots(
    1,
    2,
    gridspec_kw={"width_ratios": [1, 17]},
    constrained_layout=True,
)


plot_design_matrix(unpaired_design_matrix, rescale=False, axes=ax_unpaired)
plot_design_matrix(paired_design_matrix, rescale=False, axes=ax_paired)
ax_unpaired.set_title("unpaired design", fontsize=12)
ax_paired.set_title("paired design", fontsize=12)

show()
We specify the analysis models and fit them.
We instantiate the models with minimize_memory=False
because this is required to use plot_predicted_signal_and_residuals
to visualize the residuals time series.
from nilearn.glm.second_level import SecondLevelModel

second_level_model_unpaired = SecondLevelModel(
    n_jobs=2, verbose=1, minimize_memory=False
).fit(second_level_input, design_matrix=unpaired_design_matrix)

second_level_model_paired = SecondLevelModel(
    n_jobs=2, verbose=1, minimize_memory=False
).fit(second_level_input, design_matrix=paired_design_matrix)
[SecondLevelModel.fit] Fitting second level model. Take a deep breath.
[SecondLevelModel.fit]
Computation of second level model done in 00 HR 00 MIN 00 SEC.

[SecondLevelModel.fit] Fitting second level model. Take a deep breath.
[SecondLevelModel.fit]
Computation of second level model done in 00 HR 00 MIN 00 SEC.
Estimating the contrast is simple. To do so, we provide the column name of the design matrix. The argument ‘output_type’ is set to return all available outputs so that we can compare differences in the effect size, variance, and z-score.
stat_maps_unpaired = second_level_model_unpaired.compute_contrast(
    "vertical vs horizontal", output_type="all"
)

stat_maps_paired = second_level_model_paired.compute_contrast(
    "vertical vs horizontal", output_type="all"
)
Plot the results
The two ‘effect_size’ images are essentially identical.
(
    stat_maps_unpaired["effect_size"].get_fdata()
    - stat_maps_paired["effect_size"].get_fdata()
).max()
2.220446049250313e-15
But the variance in the unpaired image is larger.
plot_glass_brain(
    stat_maps_unpaired["effect_variance"],
    vmin=0,
    vmax=6,
    cmap="inferno",
    title="vertical vs horizontal effect variance, unpaired",
)

plot_glass_brain(
    stat_maps_paired["effect_variance"],
    vmin=0,
    vmax=6,
    cmap="inferno",
    title="vertical vs horizontal effect variance, paired",
)

show()
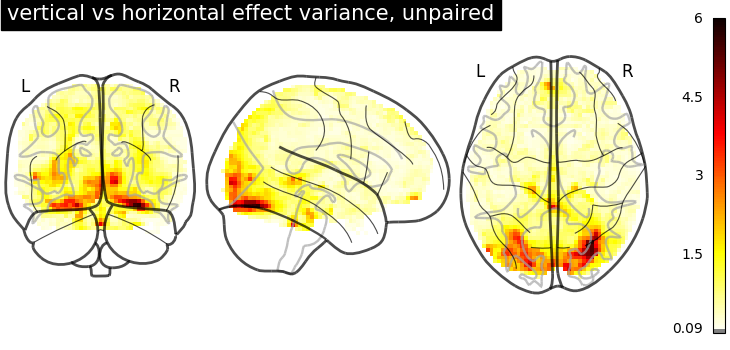
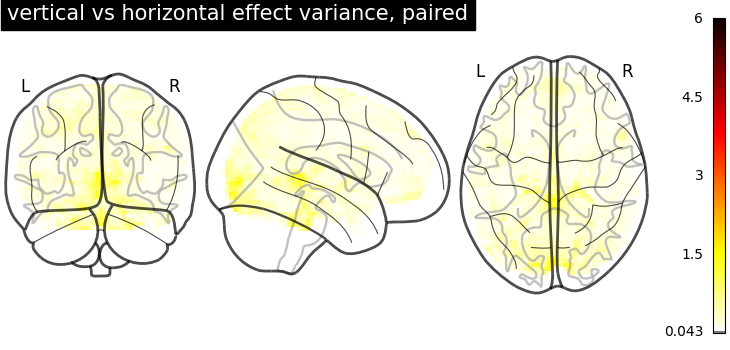
Together, this makes the z_scores from the paired test larger. We threshold the second level contrast and plot it.
threshold = 3.1  # corresponds to  p < .001, uncorrected
plot_glass_brain(
    stat_maps_unpaired["z_score"],
    threshold=threshold,
    plot_abs=False,
    vmax=5.8,
    title="vertical vs horizontal (unc p<0.001), unpaired",
)

plot_glass_brain(
    stat_maps_paired["z_score"],
    threshold=threshold,
    plot_abs=False,
    vmax=5.8,
    title="vertical vs horizontal (unc p<0.001), paired",
)

show()
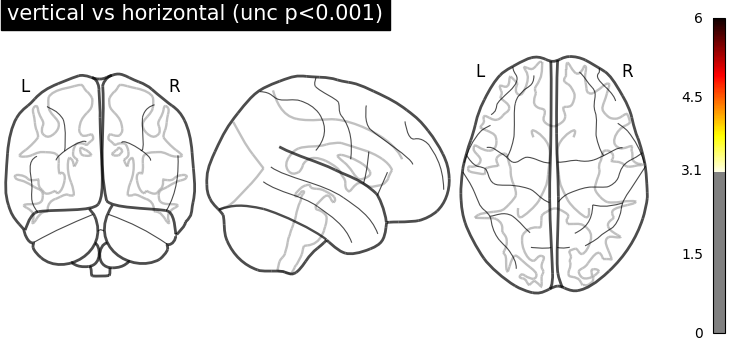
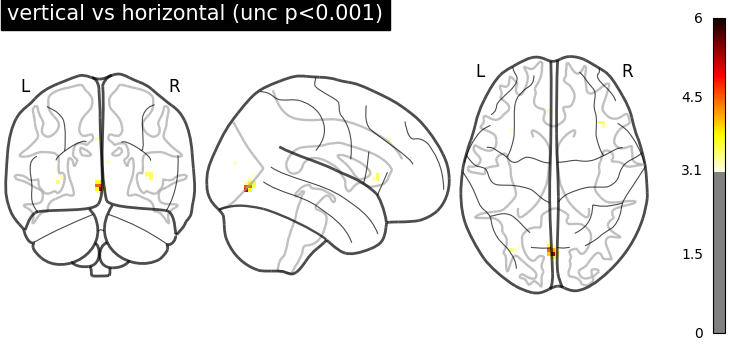
Unsurprisingly, we see activity in the primary visual cortex, both positive and negative.
Plot predicted and time series of the most significant clusters
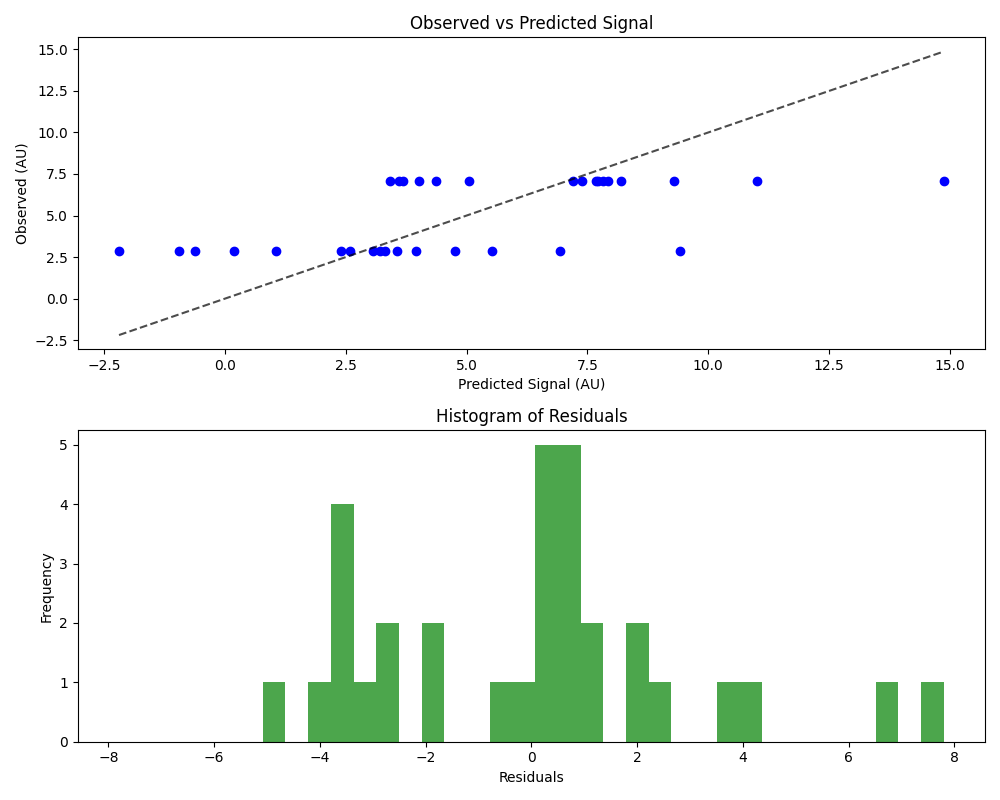
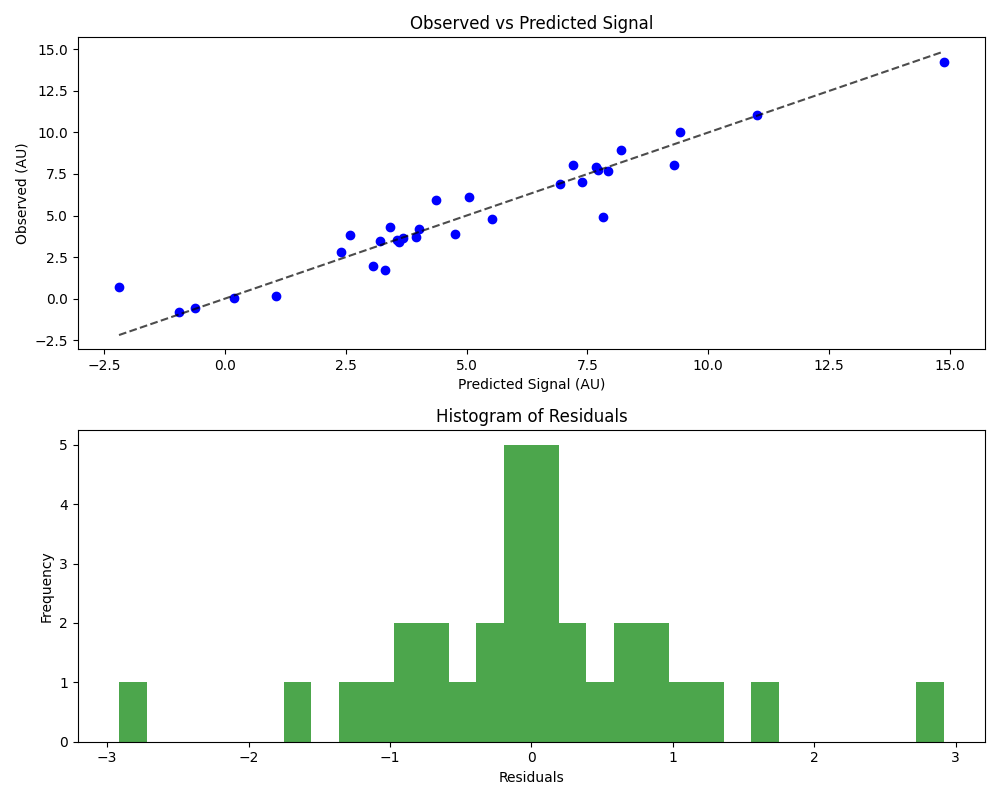
The model mispecification with an unpaired design can also be seen in the distribution of the residuals. Here we will plot it for both models in the around the the coordinates of the main peak in the most significant cluster.
from nilearn.reporting import get_clusters_table

table, _ = get_clusters_table(
    stat_maps_paired["z_score"],
    stat_threshold=threshold,
    return_label_maps=True,
)
main_peak_main_cluster = table["Cluster ID"] == 1
coords = table.loc[main_peak_main_cluster, ["X", "Y", "Z"]].to_numpy()
The unpaired model shows that there is systematic error between predicted and observed values.
Such error is not observed for the paired model.
Total running time of the script: (0 minutes 20.797 seconds)
Estimated memory usage: 314 MB
