Note
Go to the end to download the full example code. or to run this example in your browser via Binder
3D and 4D niimgs: handling and visualizing
Here we discover how to work with 3D and 4D niimgs.
Downloading tutorial datasets from Internet
Nilearn comes with functions that download public data from Internet
Let’s first check where the data is downloaded on our disk:
from nilearn.datasets import load_sample_motor_activation_image

tmap_filename = load_sample_motor_activation_image()
print(tmap_filename)
/home/runner/work/nilearn/nilearn/.tox/doc/lib/python3.11/site-packages/nilearn/datasets/data/image_10426.nii.gz
Visualizing a 3D file
The file contains a 3D volume, we can easily visualize it as a statistical map:
from nilearn.plotting import plot_stat_map

plot_stat_map(tmap_filename)
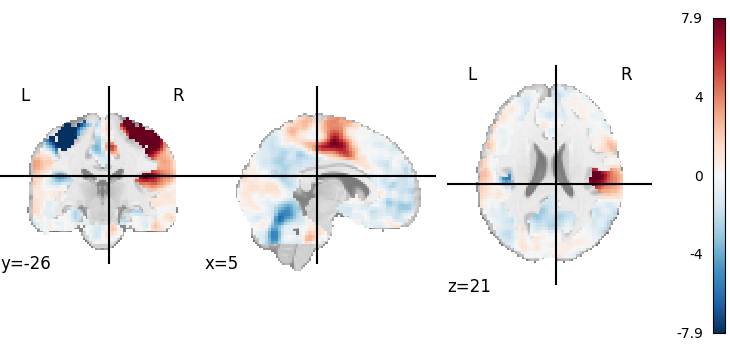
<nilearn.plotting.displays._slicers.OrthoSlicer object at 0x7ff947d02a50>
Calling show function
from nilearn.plotting package is necessary to display the figure
when running as a script outside IPython.
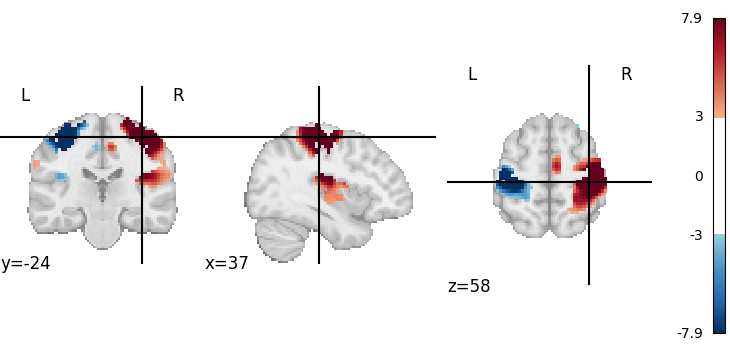
Visualizing works better with a threshold
plot_stat_map(tmap_filename, threshold=3)

show()
Visualizing one volume in a 4D file
We can download resting-state networks from the Smith 2009 study on correspondence between rest and task.
from nilearn.datasets import fetch_atlas_smith_2009

rsn = fetch_atlas_smith_2009(resting=True, dimension=10)["maps"]
print(rsn)
[fetch_atlas_smith_2009] Dataset directory found: /home/runner/work/nilearn/nilearn/nilearn_data/smith_2009
[fetch_atlas_smith_2009] Downloading data from https://www.fmrib.ox.ac.uk/datasets/brainmap+rsns/PNAS_Smith09_rsn10.nii.gz ...
Downloading PNAS_Smith09_rsn10.nii.gz ━━━━━━━━━━━━━━ 7.6/7.6 MB 3.7 MB/s 0:00:00
[fetch_atlas_smith_2009]  ...done. (3 seconds, 0 min)

/home/runner/work/nilearn/nilearn/nilearn_data/smith_2009/PNAS_Smith09_rsn10.nii.gz
It is a 4D nifti file.
the nilearn.image package
provides some utility functions to work with image files.
We can load it into the memory to print its shape.
(91, 109, 91, 10)
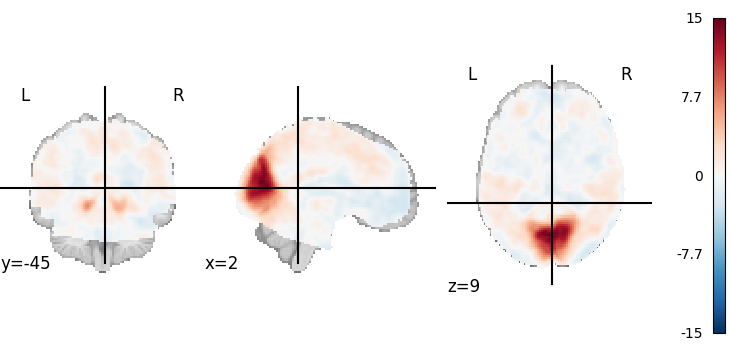
We can retrieve the first volume (note that Python indexing starts at 0):
(91, 109, 91)
first_rsn is a 3D image.
We can then plot it
Looping on all volumes in a 4D file
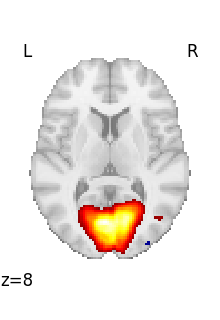
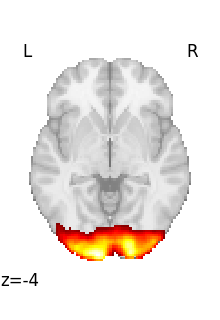
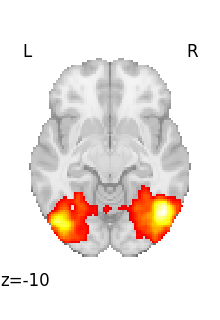
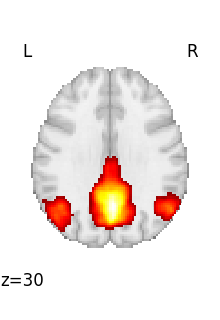
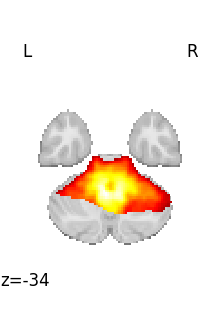
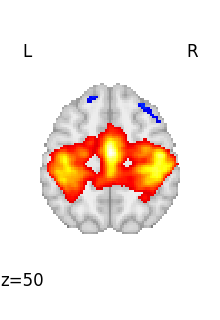
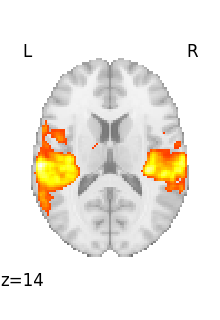
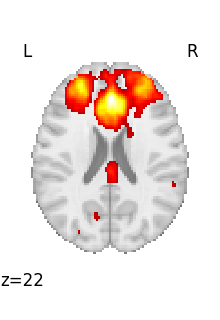
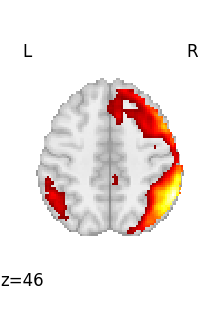
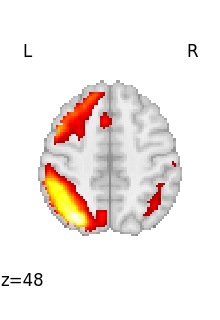
If we want to plot all the volumes in this 4D file, we can use iter_img to loop on them.
Then we give a few arguments to plot_stat_map in order to have a more compact display.
Looping through selected volumes in a 4D file
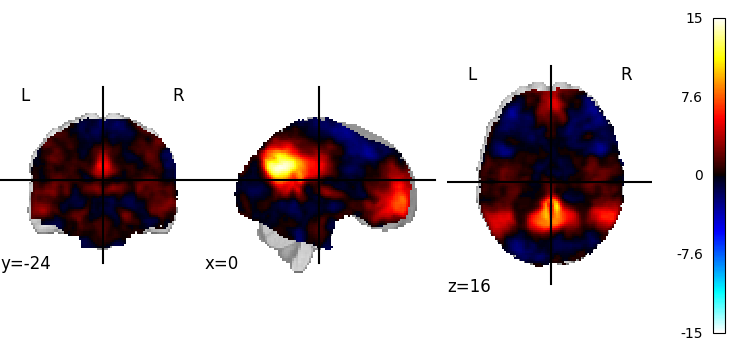
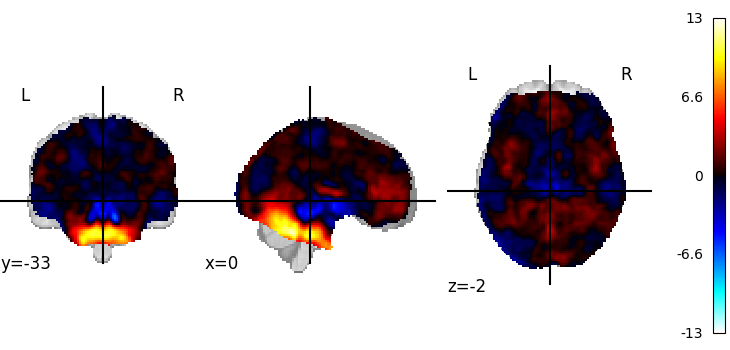
If we want to plot selected volumes in this 4D file, we can use index_img with the slice constructor to select the desired volumes.
Afterwards, we’ll use iter_img to loop through them following the same formula as before.
selected_volumes = index_img(rsn, slice(3, 5))
If you’re new to Python, one thing to note is that the slice constructor uses 0-based indexing. You can confirm this by matching these slices to the previous plot above.
for img in iter_img(selected_volumes):
    plot_stat_map(img)

show()
To recap, neuroimaging images (niimgs as we call them) come in different flavors:
3D images, containing only one brain volume
4D images, containing multiple brain volumes.
More details about the input formats in nilearn for 3D and 4D images is given in the documentation section: Inputting data: file names or image objects.
Functions accept either 3D or 4D images, and we need to use on the one
hand index_img or iter_img
to break down 4D images into 3D images, and on the other hand
concat_imgs to group a list of 3D images into a 4D
image.
Total running time of the script: (0 minutes 10.775 seconds)
Estimated memory usage: 275 MB
