Note
This page is a reference documentation. It only explains the function signature, and not how to use it. Please refer to the user guide for the big picture.
nilearn.plotting.plot_event
- nilearn.plotting.plot_event(model_event, cmap=None, output_file=None, **fig_kwargs)[source]
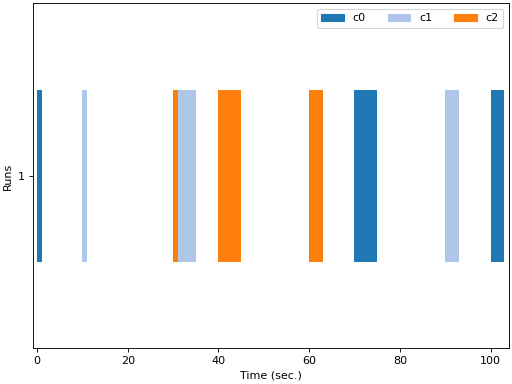
Create plot for event visualization.
Warning
Events with a duration of 0 seconds will be plotted by a ‘delta function’.
- Parameters:
- model_event
pandas.DataFrame,strorpathlib.Pathto a TSV event file, or alistortupleofpandas.DataFrame,strorpathlib.Pathto a TSV event file. The
pandas.DataFramemust have three columns:trial_typewith event name,onsetandduration. Seemake_first_level_design_matrixfor details on the required content of events dataframes.Note
The
pandas.DataFramecan also be obtained fromnilearn.glm.first_level.first_level_from_bids.- cmap
matplotlib.colors.Colormap, orstr, optional The colormap to use. Either a string which is a name of a matplotlib colormap, or a matplotlib colormap object.
- output_file
strorpathlib.Pathor None, default=None The name of an image file to export the plot to. Valid extensions are .png, .pdf, .svg. If output_file is not
None, the plot is saved to a file, and the display is closed.- **fig_kwargsextra keyword arguments, optional
Extra arguments passed to
matplotlib.pyplot.subplots.
- model_event
- Returns:
- figure
matplotlib.figure.Figure Plot Figure object.
- figure
Examples
>>> import pandas as pd
>>>
>>> from nilearn.plotting import plot_event, show
>>>
>>> trial_type = ["c0", "c0", "c0", "c1", "c1", "c1", "c2", "c2", "c2"]
>>> onset = [0, 70, 100, 10, 30, 90, 30, 40, 60]
>>> duration =  [1, 5, 3] * 3
>>> model_event = pd.DataFrame({"onset": onset,
...                             "duration": duration,
...                             "trial_type": trial_type})
>>>
>>> fig = plot_event(model_event)
>>>
>>> show()
Examples using nilearn.plotting.plot_event
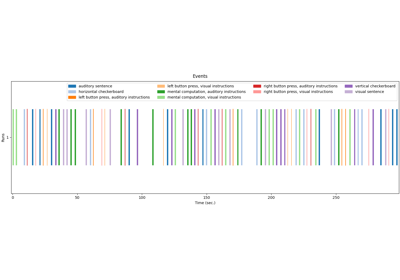
Generate an events.tsv file for the NeuroSpin localizer task