Note
Go to the end to download the full example code. or to run this example in your browser via Binder
Examples of design matrices
Three examples of design matrices specification and computation for first-level fMRI data analysis (event-related design, block design, FIR design).
This examples requires matplotlib.
Define parameters
At first, we define parameters related to the images acquisition.
import numpy as np

from nilearn.plotting import plot_design_matrix

t_r = 1
n_scans = 128

print(f"repetition time is {t_r} second")
print(f"the acquisition comprises {n_scans} scans")

frame_times = (
    np.arange(n_scans) * t_r
)  # here are the corresponding frame times
repetition time is 1 second
the acquisition comprises 128 scans
Then we define parameters related to the experimental design.
# these are the types of the different trials
conditions = ["c0", "c0", "c0", "c1", "c1", "c1", "c3", "c3", "c3"]
duration = [0.1, 0.0, 0.1, 0.1, 0.0, 0.1, 0.1, 0.0, 0.1]
# these are the corresponding onset times
onsets = [30.0, 70.0, 100.0, 10.0, 30.0, 90.0, 30.0, 40.0, 60.0]
# Next, we simulate 6 motion parameters jointly observed with fMRI acquisitions
rng = np.random.default_rng(42)
motion = np.cumsum(rng.standard_normal((n_scans, 6)), 0)
# The 6 parameters correspond to three translations and three
# rotations describing rigid body motion
add_reg_names = ["tx", "ty", "tz", "rx", "ry", "rz"]
Create design matrices
The same parameters allow us to obtain a variety of design matrices. We first create an events object.
import pandas as pd

events = pd.DataFrame(
    {"trial_type": conditions, "onset": onsets, "duration": duration}
)
We sample the events into a design matrix, also including additional regressors.
from nilearn.glm.first_level import make_first_level_design_matrix

hrf_model = "glover"
X1 = make_first_level_design_matrix(
    frame_times,
    events,
    drift_model="polynomial",
    drift_order=3,
    add_regs=motion,
    add_reg_names=add_reg_names,
    hrf_model=hrf_model,
)
/home/runner/work/nilearn/nilearn/examples/04_glm_first_level/plot_design_matrix.py:63: UserWarning:

The following conditions contain events with null duration:
- 'c0'
- 'c1'
- 'c3'
Now we compute a block design matrix. We add duration to create the blocks. For this we first define an event structure that includes the duration parameter.
duration = 7.0 * np.ones(len(conditions))
events = pd.DataFrame(
    {"trial_type": conditions, "onset": onsets, "duration": duration}
)
Then we sample the design matrix.
X2 = make_first_level_design_matrix(
    frame_times,
    events,
    drift_model="polynomial",
    drift_order=3,
    hrf_model=hrf_model,
)
Finally we compute a FIR model
events = pd.DataFrame(
    {"trial_type": conditions, "onset": onsets, "duration": duration}
)
hrf_model = "FIR"
X3 = make_first_level_design_matrix(
    frame_times,
    events,
    hrf_model="fir",
    drift_model="polynomial",
    drift_order=3,
    fir_delays=np.arange(1, 6),
)
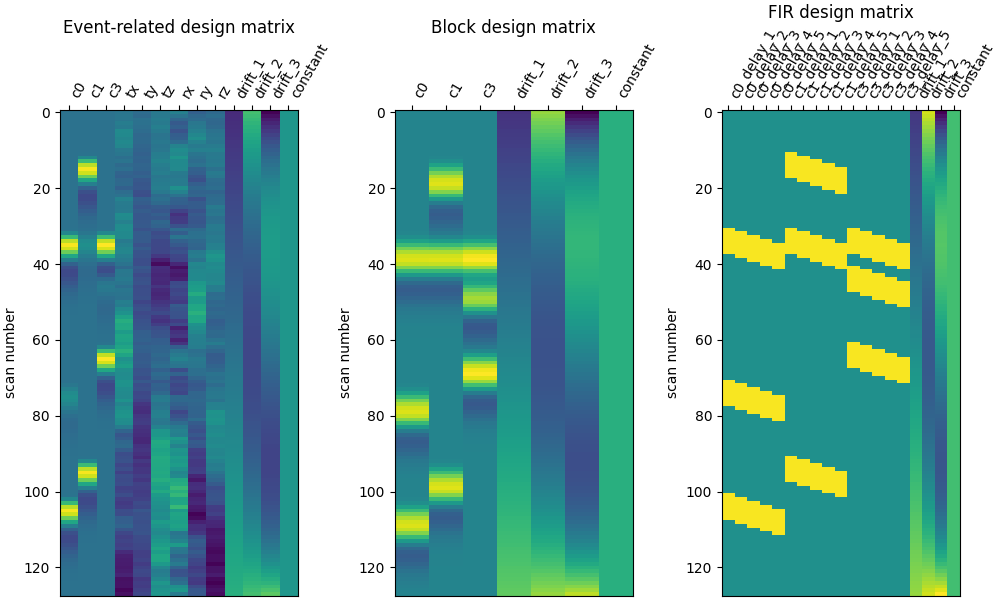
Here are the three designs side by side.
Note
The events with a duration of 0 seconds are be modeled using a ‘delta function’ in the event-related design matrix.
import matplotlib.pyplot as plt

fig, (ax1, ax2, ax3) = plt.subplots(
    figsize=(10, 6), nrows=1, ncols=3, constrained_layout=True
)

plot_design_matrix(X1, axes=ax1)
ax1.set_title("Event-related design matrix", fontsize=12)
plot_design_matrix(X2, axes=ax2)
ax2.set_title("Block design matrix", fontsize=12)
plot_design_matrix(X3, axes=ax3)
ax3.set_title("FIR design matrix", fontsize=12)
plt.show()
Correlation between regressors
We can plot the correlation between the regressors of our design matrix. This is important to check as highly correlated regressors can affect the effficieny of your design.
from nilearn.plotting import plot_design_matrix_correlation

fig, (ax1, ax2, ax3) = plt.subplots(
    figsize=(16, 5), nrows=1, ncols=3, constrained_layout=True
)

plot_design_matrix_correlation(X1, axes=ax1)
ax1.set_title("Event-related correlation matrix", fontsize=12)
plot_design_matrix_correlation(X2, axes=ax2)
ax2.set_title("Block correlation matrix", fontsize=12)
plot_design_matrix_correlation(X3, axes=ax3, tri="diag")
ax3.set_title("FIR correlation matrix", fontsize=12)
plt.show()

Parametric modulation
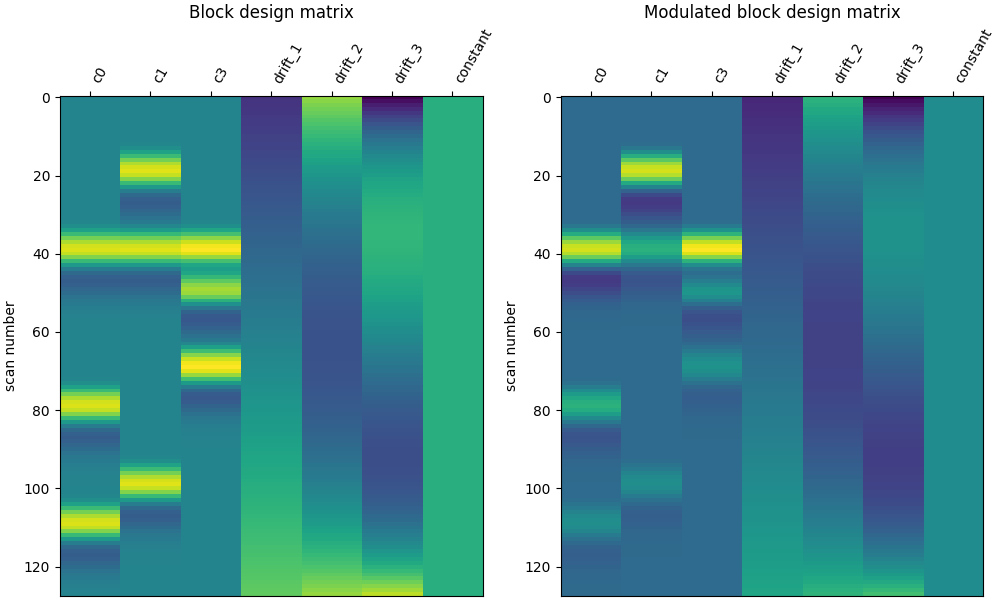
By default, the fMRI GLM will expect that all events for a given condition have a BOLD response with the same amplitude. Sometimes, we may have specific expectations about how strong the BOLD response will be on a given event. This can be incorporated into the model by using parametric modulation, wherein each event has a predicted amplitude. This can be used both to improve model fit and to test hypotheses regarding how the BOLD response scales with important features of events, such as trial intensity or response time.
Here we will assume that when a trial is the same condition as the previous one, it will elicit a less intense response.
conditions = ["c0", "c0", "c0", "c1", "c1", "c1", "c3", "c3", "c3"]
modulation = [1.0, 0.5, 0.25, 1.0, 0.5, 0.25, 1.0, 0.5, 0.25]
modulated_events = pd.DataFrame(
    {
        "trial_type": conditions,
        "onset": onsets,
        "duration": duration,
        "modulation": modulation,
    }
)

hrf_model = "glover"
X4 = make_first_level_design_matrix(
    frame_times,
    modulated_events,
    drift_model="polynomial",
    drift_order=3,
    hrf_model=hrf_model,
)

# Let's compare it to the unmodulated block design
fig, (ax1, ax2) = plt.subplots(
    figsize=(10, 6), nrows=1, ncols=2, constrained_layout=True
)

plot_design_matrix(X2, axes=ax1)
ax1.set_title("Block design matrix", fontsize=12)
plot_design_matrix(X4, axes=ax2)
ax2.set_title("Modulated block design matrix", fontsize=12)
plt.show()
[make_first_level_design_matrix] A 'modulation' column was found in the given
events data and is used.
Total running time of the script: (0 minutes 5.735 seconds)
Estimated memory usage: 131 MB