Note
Go to the end to download the full example code. or to run this example in your browser via Binder
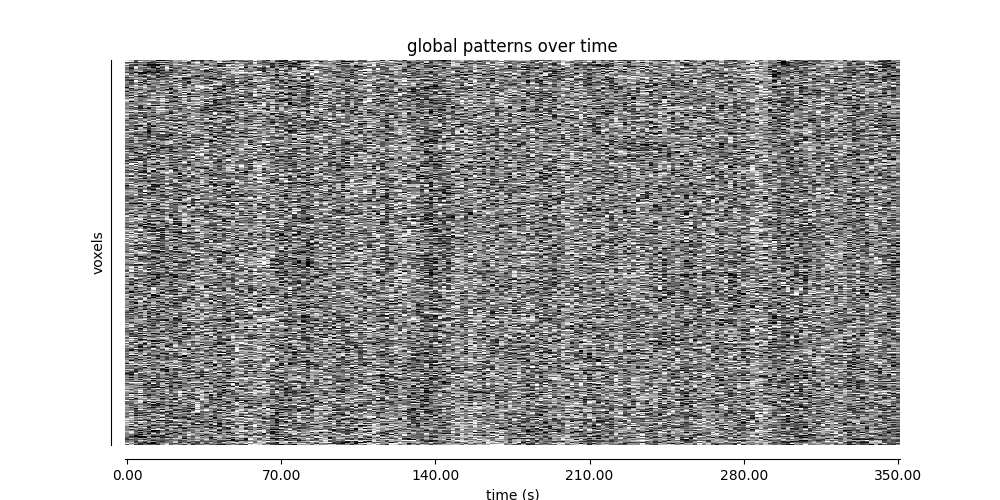
Visualizing global patterns with a carpet plot
A common quality control step for functional MRI data is to visualize the data over time in a carpet plot (also known as a Power plot or a grayplot).
The plot_carpet function generates a carpet plot
from a 4D functional image,
where each row in the plot is the time-series for a given voxel.
This figure was originally developed in Power[1].
Fetching data from ADHD dataset
For more information see the dataset description.
from nilearn.datasets import fetch_adhd

adhd_dataset = fetch_adhd(n_subjects=1)

# Print basic information on the dataset
print(
    f"First subject functional nifti image (4D) is at: {adhd_dataset.func[0]}"
)
[fetch_adhd] Dataset directory found:
/home/runner/work/nilearn/nilearn/nilearn_data/adhd
First subject functional nifti image (4D) is at: /home/runner/work/nilearn/nilearn/nilearn_data/adhd/data/0010042/0010042_rest_tshift_RPI_voreg_mni.nii.gz
Deriving a mask
Build an EPI-based mask because we have no anatomical data
from nilearn import masking

mask_img = masking.compute_epi_mask(adhd_dataset.func[0])
Visualizing global patterns over time
import matplotlib.pyplot as plt

from nilearn.plotting import plot_carpet, show

plot_carpet(
    adhd_dataset.func[0],
    mask_img,
    t_r=adhd_dataset.t_r,
    title="global patterns over time",
)

show()
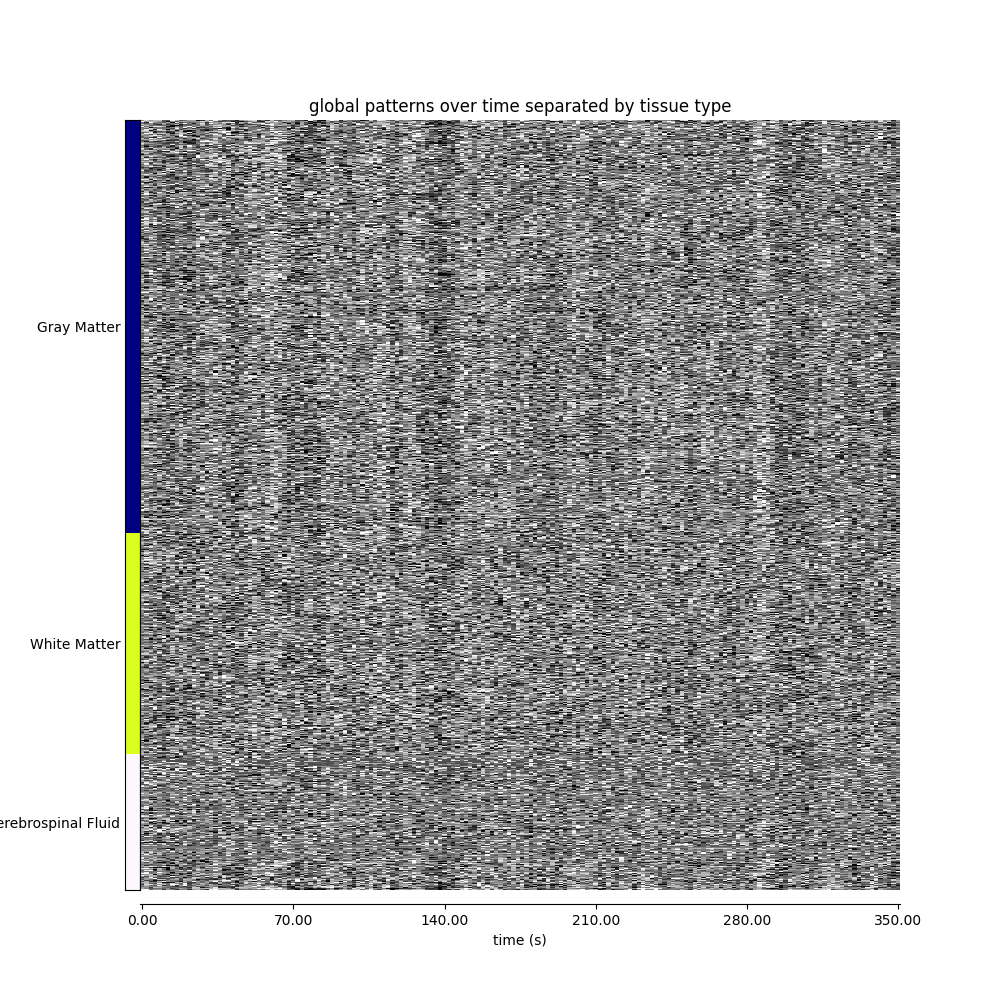
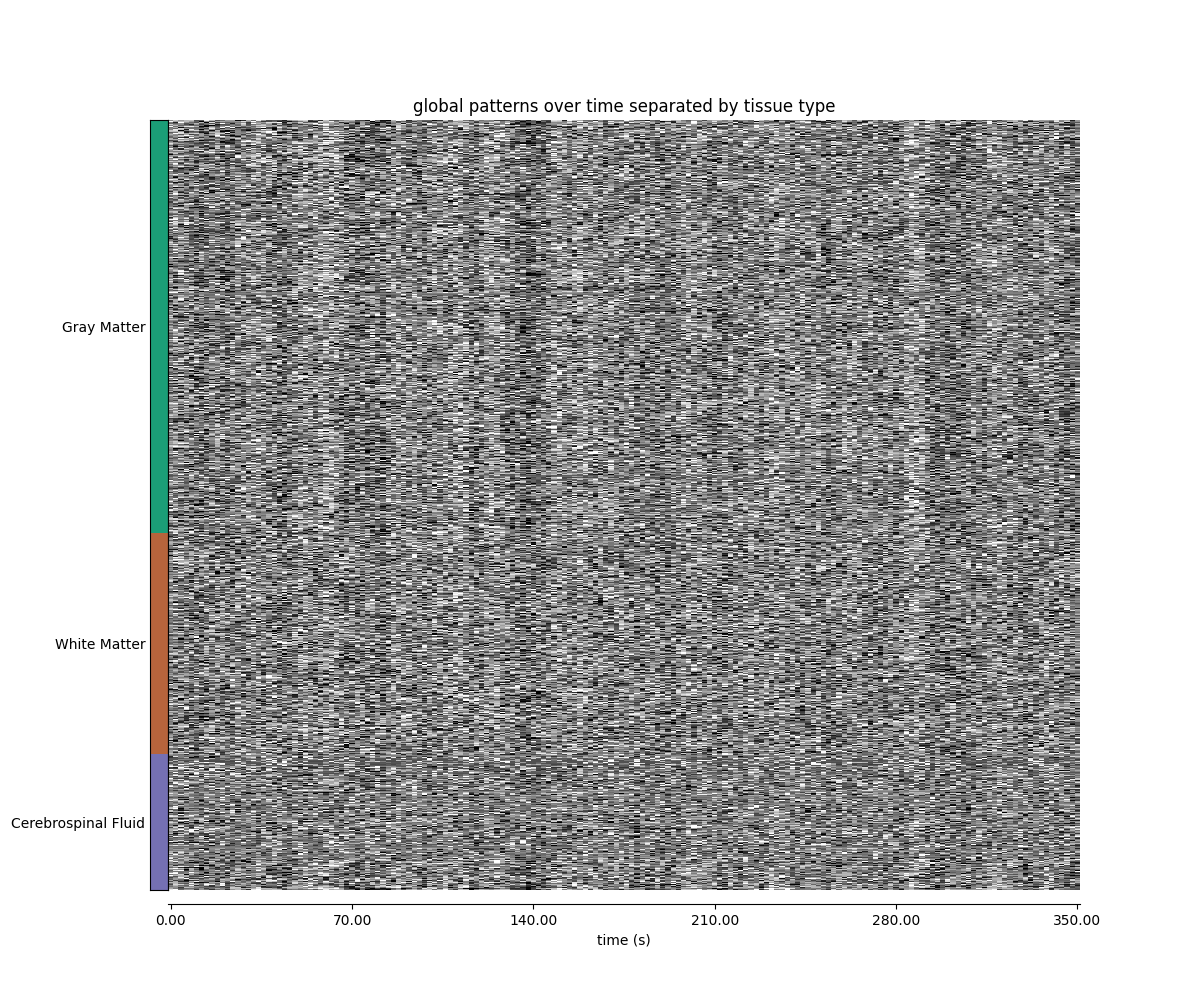
Deriving a label-based mask
Carpet plots can also be organized, by sorting voxels in different regions of interest. To demonstrate this, let’s create and visualize a gray matter/white matter/cerebrospinal fluid mask from ICBM152 tissue probability maps.
import numpy as np
from matplotlib import colors

from nilearn import image
from nilearn.datasets import fetch_icbm152_2009
from nilearn.plotting import plot_roi

atlas = fetch_icbm152_2009()

atlas_img = image.concat_imgs(
    (
        atlas["gm"],
        atlas["wm"],
        atlas["csf"],
    )
)

map_labels = {
    "Gray Matter": 1,
    "White Matter": 2,
    "Cerebrospinal Fluid": 3,
}

atlas_data = atlas_img.get_fdata()

discrete_version = np.argmax(atlas_data, axis=3) + 1
discrete_version[np.max(atlas_data, axis=3) == 0] = 0

discrete_atlas_img = image.new_img_like(
    atlas_img, discrete_version.astype(np.float32)
)

cmap = colors.LinearSegmentedColormap.from_list(
    "3_colors",
    [
        "#1b9e77",
        "#d95f02",
        "#7570b3",
    ],
    N=4,
)
plot_roi(
    discrete_atlas_img,
    cmap=cmap,
    title="gray matter / white matter / cerebrospinal fluid masks",
)

show()
[fetch_icbm152_2009] Dataset directory found:
/home/runner/work/nilearn/nilearn/nilearn_data/icbm152_2009
Visualizing global patterns, separated by tissue type
fig, ax = plt.subplots(figsize=(12, 10))

display = plot_carpet(
    adhd_dataset.func[0],
    discrete_atlas_img,
    t_r=adhd_dataset.t_r,
    mask_labels=map_labels,
    axes=ax,
    title="global patterns over time separated by tissue type",
    cmap_labels=cmap,
)

show()
[plot_carpet] Coercing atlas_values to int
References
Total running time of the script: (0 minutes 21.956 seconds)
Estimated memory usage: 1120 MB