Note
This page is a reference documentation. It only explains the function signature, and not how to use it. Please refer to the user guide for the big picture.
nilearn.datasets.fetch_atlas_destrieux_2009
- nilearn.datasets.fetch_atlas_destrieux_2009(lateralized=True, data_dir=None, url=None, resume=True, verbose=1)[source]
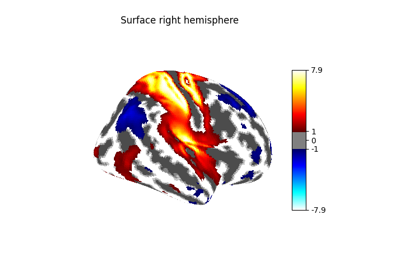
Download and load the Destrieux cortical deterministic atlas (dated 2009).
See Fischl et al.[1], and Destrieux et al.[2].
Note
Some labels from the list of labels might not be present in the atlas image, in which case the integer values in the image might not be consecutive.
- Parameters:
- lateralized
bool, default=True If True, returns an atlas with distinct regions for right and left hemispheres.
- data_dir
pathlib.Pathorstror None, optional Path where data should be downloaded. By default, files are downloaded in a
nilearn_datafolder in the home directory of the user. See alsonilearn.datasets.utils.get_data_dirs.- url
stror None, default=None URL of file to download. Override download URL. Used for test only (or if you setup a mirror of the data).
- resume
bool, default=True Whether to resume download of a partly-downloaded file.
- verbose
boolorint, default=1 Verbosity level (
0orFalsemeans no message).
- lateralized
- Returns:
- data
sklearn.utils.Bunch Dictionary-like object, contains:
- ‘maps’:
str path to nifti file containing the
Nifti1Imagedefining the cortical ROIs, lateralized or not. The image has shape(76, 93, 76), and contains integer values which can be interpreted as the indices in the list of labels.
- ‘maps’:
- ‘description’
str Description of the dataset.
- ‘description’
- lut
pandas.DataFrame Act as a look up table (lut) with at least columns ‘index’ and ‘name’. Formatted according to ‘dseg.tsv’ format from BIDS.
- lut
- ‘template’
str The standardized space of analysis in which the atlas results are provided. When known it should be a valid template name taken from the spaces described in the BIDS specification.
- ‘template’
- ‘atlas_type’
str Type of atlas. See Probabilistic atlas and Deterministic atlas.
- ‘atlas_type’
- data
References
