Note
Go to the end to download the full example code. or to run this example in your browser via Binder
NeuroImaging volumes visualization
Simple example to show Nifti data visualization.
Fetch data
from nilearn import datasets

# By default 2nd subject will be fetched
haxby_dataset = datasets.fetch_haxby()

# print basic information on the dataset
print(
    f"First anatomical nifti image (3D) is located at: {haxby_dataset.anat[0]}"
)
print(
    f"First functional nifti image (4D) is located at: {haxby_dataset.func[0]}"
)
[fetch_haxby] Dataset directory found:
/home/runner/work/nilearn/nilearn/nilearn_data/haxby2001
First anatomical nifti image (3D) is located at: /home/runner/work/nilearn/nilearn/nilearn_data/haxby2001/subj2/anat.nii.gz
First functional nifti image (4D) is located at: /home/runner/work/nilearn/nilearn/nilearn_data/haxby2001/subj2/bold.nii.gz
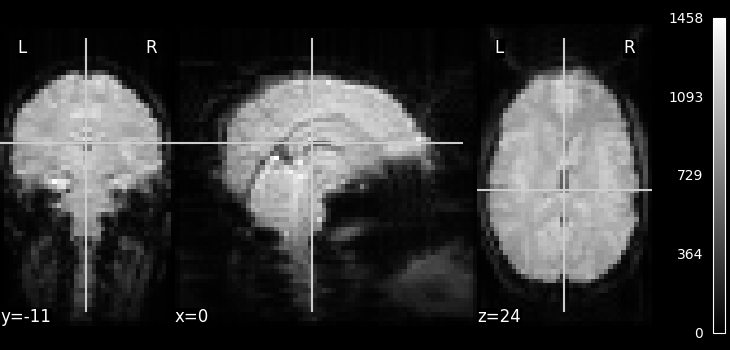
Visualization
from nilearn.image.image import mean_img

# Compute the mean EPI: we do the mean along the axis 3, which is time
func_filename = haxby_dataset.func[0]
mean_haxby = mean_img(func_filename)

from nilearn.plotting import plot_epi, show

plot_epi(mean_haxby, cbar_tick_format="%i")
<nilearn.plotting.displays._slicers.OrthoSlicer object at 0x7f2b28085630>
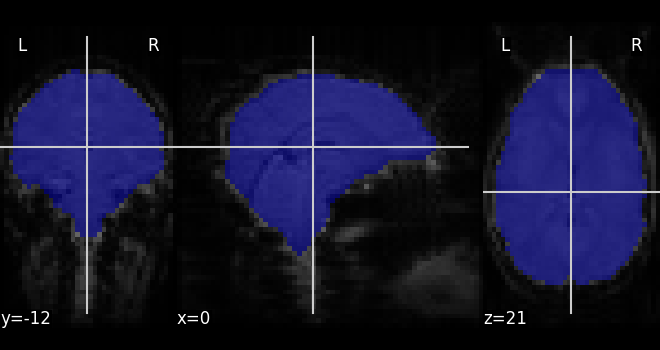
Extracting a brain mask
Simple computation of a mask from the fMRI data
from nilearn.masking import compute_epi_mask

mask_img = compute_epi_mask(func_filename)

# Visualize it as an ROI
from nilearn.plotting import plot_roi

plot_roi(mask_img, mean_haxby, colorbar=False)
<nilearn.plotting.displays._slicers.OrthoSlicer object at 0x7f2b03628940>
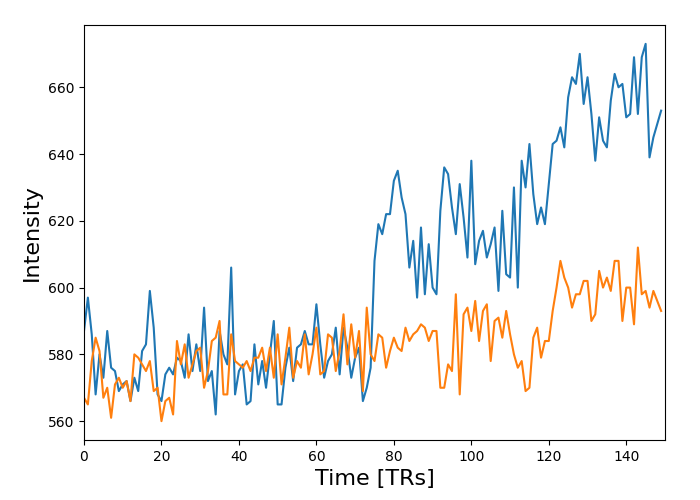
Applying the mask to extract the corresponding time series
from nilearn.masking import apply_mask

masked_data = apply_mask(func_filename, mask_img)

# masked_data shape is (timepoints, voxels). We can plot the first 150
# timepoints from two voxels

# And now plot a few of these
import matplotlib.pyplot as plt

plt.figure(figsize=(7, 5))
plt.plot(masked_data[:150, :2])
plt.xlabel("Time [TRs]", fontsize=16)
plt.ylabel("Intensity", fontsize=16)
plt.xlim(0, 150)
plt.subplots_adjust(bottom=0.12, top=0.95, right=0.95, left=0.12)

show()
Total running time of the script: (0 minutes 13.149 seconds)
Estimated memory usage: 1492 MB