Note
Go to the end to download the full example code. or to run this example in your browser via Binder
Image thresholding
The goal of this example is to illustrate the use of the function
threshold_img together with threshold and
two_sided parameters to view certain values in image data.
The threshold parameter can take both positive and negative values.
two_sided parameter is complementary to threshold effecting its
behavior.
Image without threshold
We will first load the dataset and display the image without manipulation.
from nilearn import datasets
from nilearn.plotting import plot_stat_map, show

image = datasets.load_sample_motor_activation_image()

plot_param = {
    "display_mode": "ortho",
    "cut_coords": [5, -26, 21],
    "draw_cross": False,
}

plot_stat_map(image, title="image without threshold", **plot_param)

show()
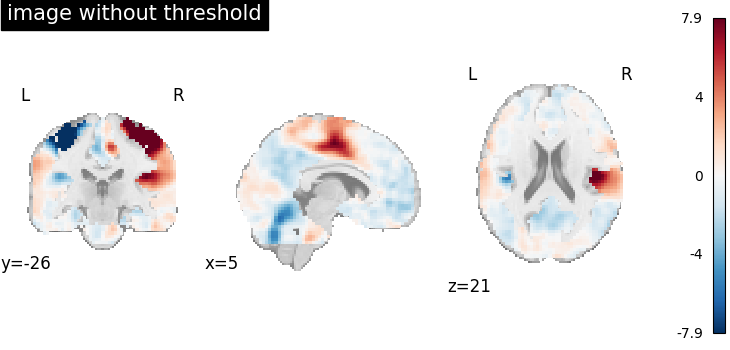
Image thresholded at 2 when two_sided=True
Now we will use threshold=2 together with two_sided=True
to threshold the image.
When two_sided=True,
we can only use positive values for threshold.
This will set all image values between -2 and 2 to 0.
Note
You can get a similar result by passing threshold directly when plotting. In this case the colorbar will adapt to show which part of the image was masked.
import matplotlib.pyplot as plt

from nilearn.image import threshold_img

thresholded_img = threshold_img(
    image, threshold=2, cluster_threshold=0, two_sided=True, copy=True
)

figure_width = 8

fig, axes = plt.subplots(
    3,
    1,
    figsize=(figure_width, 13),
)

plot_stat_map(
    image, title="image without threshold", axes=axes[0], **plot_param
)

plot_stat_map(
    thresholded_img,
    title="image thresholded at 2 before plotting with two_sided=True",
    axes=axes[1],
    **plot_param,
)

plot_stat_map(
    image,
    title="image thresholded during plotting",
    threshold=2,
    axes=axes[2],
    **plot_param,
)

show()
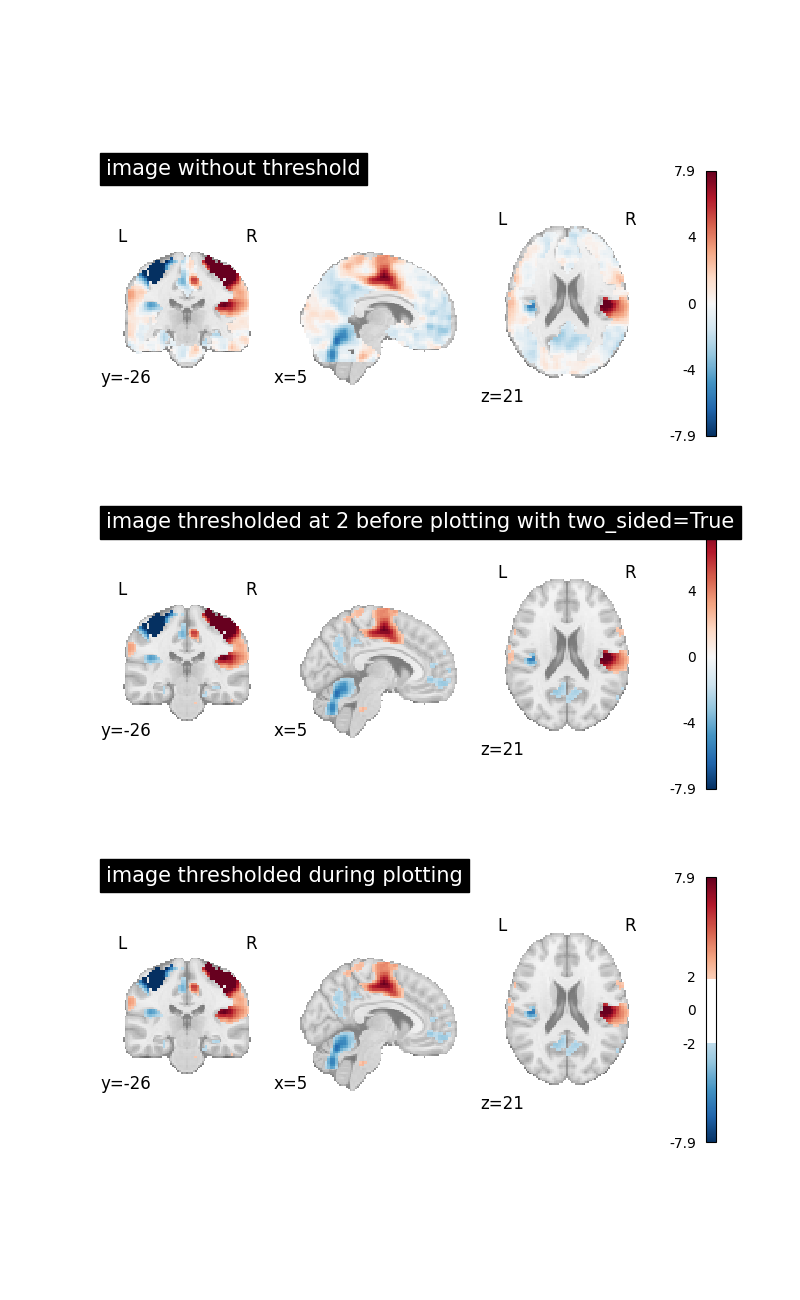
Image thresholded at 2 when two_sided=False
Now we will use threshold=2 together with two_sided=False
to see the effect.
This will set all image values below 2 to 0.
thresholded_img = threshold_img(
    image, threshold=2, cluster_threshold=0, two_sided=False, copy=True
)


fig, axes = plt.subplots(
    2,
    1,
    figsize=(figure_width, 8),
)


plot_stat_map(
    image, title="image without threshold", axes=axes[0], **plot_param
)

plot_stat_map(
    thresholded_img,
    cmap="Reds",
    title="image thresholded at 2 with two_sided=False",
    axes=axes[1],
    **plot_param,
)

show()
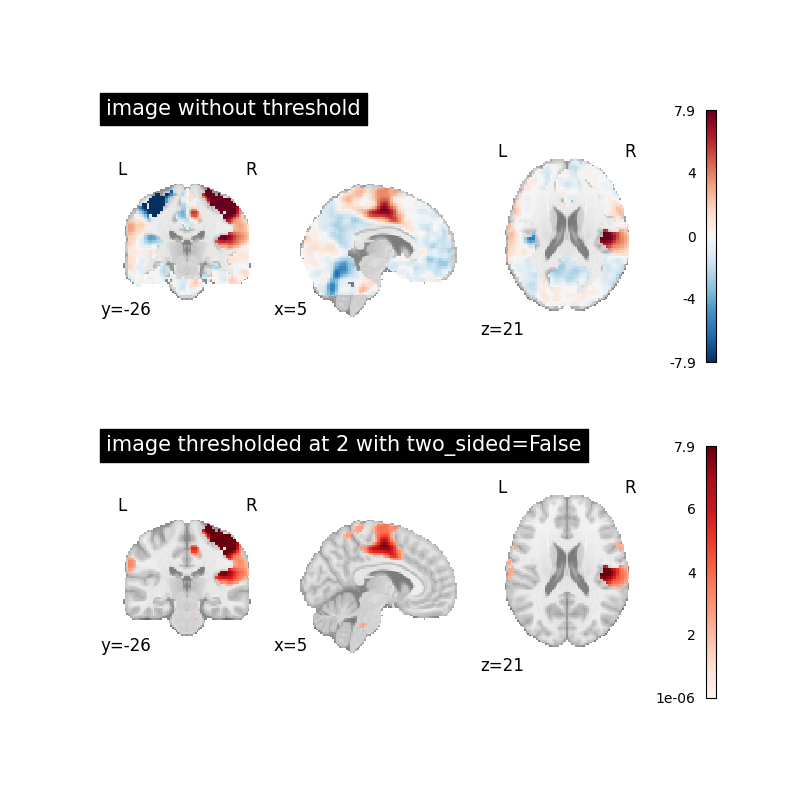
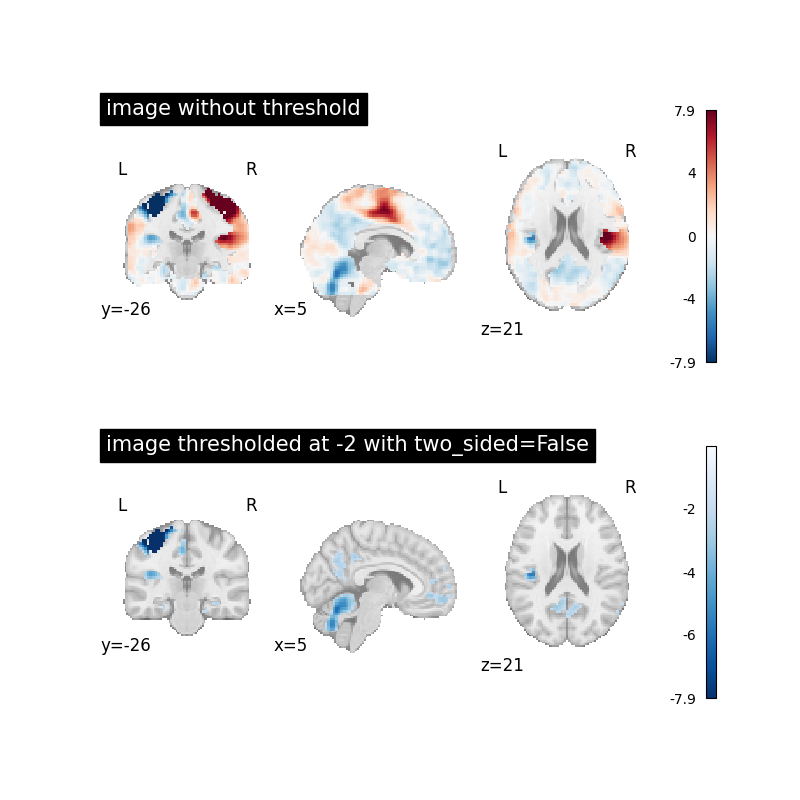
Image thresholded at -2 when two_sided=False
Now we will use threshold=-2 together with two_sided=False to
see the effect.
This will set all image values above -2 to 0.
thresholded_img = threshold_img(
    image, threshold=-2, cluster_threshold=0, two_sided=False, copy=True
)


fig, axes = plt.subplots(
    2,
    1,
    figsize=(figure_width, 8),
)

plot_stat_map(
    image, title="image without threshold", axes=axes[0], **plot_param
)

plot_stat_map(
    thresholded_img,
    cmap="Blues_r",
    title="image thresholded at -2 with two_sided=False",
    axes=axes[1],
    **plot_param,
)

show()
Total running time of the script: (0 minutes 4.524 seconds)
Estimated memory usage: 131 MB