Note
Go to the end to download the full example code. or to run this example in your browser via Binder
Regions Extraction of Default Mode Networks using Smith Atlas
This simple example shows how to extract regions from Smith atlas resting state networks.
In particular, we show how Default Mode Network regions are extracted
using RegionExtractor from regions module
Fetching the smith ICA 10 RSN by importing datasets utilities
from nilearn import datasets

atlas_networks = datasets.fetch_atlas_smith_2009(resting=True, dimension=10)[
    "maps"
]
[fetch_atlas_smith_2009] Dataset directory found:
/home/runner/work/nilearn/nilearn/nilearn_data/smith_2009
Import region extractor to extract atlas networks
from nilearn.regions import RegionExtractor

# min_region_size in voxel volume mm^3
extraction = RegionExtractor(
    atlas_networks,
    min_region_size=800,
    threshold=98,
    thresholding_strategy="percentile",
    verbose=1,
)

# Just call fit() to execute region extraction procedure
extraction.fit()
regions_img = extraction.regions_img_
\[RegionExtractor.fit] Loading regions from <nibabel.nifti1.Nifti1Image object
at 0x7f9e7f28d8d0>
\[RegionExtractor.fit] Finished fit
Visualization Show region extraction results by importing image & plotting utilities
from nilearn import plotting
from nilearn.image import index_img
from nilearn.plotting import find_xyz_cut_coords
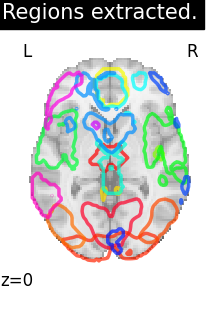
# Showing region extraction results using 4D maps visualization tool
plotting.plot_prob_atlas(
regions_img,
display_mode="z",
cut_coords=1,
view_type="contours",
title="Regions extracted.",
)
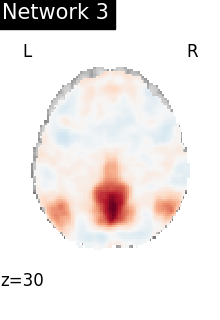
# To reduce the complexity, we choose to display all the regions
# extracted from network 3
import numpy as np
DMN_network = index_img(atlas_networks, 3)
plotting.plot_stat_map(
DMN_network,
display_mode="z",
cut_coords=1,
title="Network 3",
colorbar=False,
)
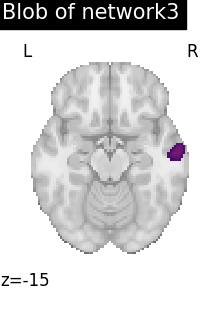
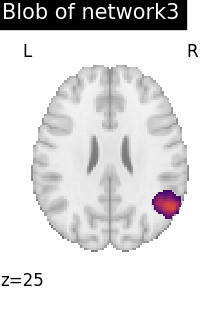
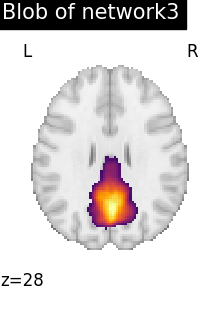
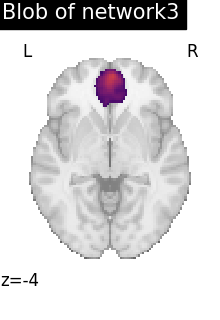
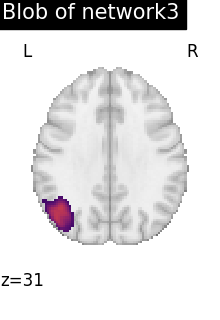
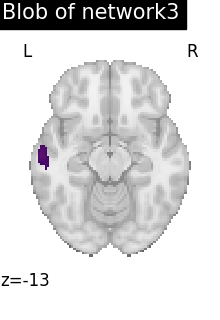
regions_indices_network3 = np.where(np.array(extraction.index_) == 3)
for index in regions_indices_network3[0]:
cur_img = index_img(extraction.regions_img_, index)
coords = find_xyz_cut_coords(cur_img)
plotting.plot_stat_map(
cur_img,
display_mode="z",
cut_coords=coords[2:3],
title="Blob of network3",
colorbar=False,
cmap="inferno",
vmax=15,
)
plotting.show()
Total running time of the script: (1 minutes 18.857 seconds)
Estimated memory usage: 613 MB