Note
Go to the end to download the full example code or to run this example in your browser via Binder.
Different classifiers in decoding the Haxby dataset
Here we compare different classifiers on a visual object recognition decoding task.
# We start by loading data using nilearn dataset fetcher
from nilearn import datasets
from nilearn.image import get_data
from nilearn.plotting import plot_stat_map, show
Loading the data
# by default 2nd subject data will be fetched
haxby_dataset = datasets.fetch_haxby()

# print basic information on the dataset
print(
    "First subject anatomical nifti image (3D) located is "
    f"at: {haxby_dataset.anat[0]}"
)
print(
    "First subject functional nifti image (4D) is located "
    f"at: {haxby_dataset.func[0]}"
)

# load labels
import numpy as np
import pandas as pd

labels = pd.read_csv(haxby_dataset.session_target[0], sep=" ")
stimuli = labels["labels"]

# identify resting state (baseline) labels in order to be able to remove them
resting_state = stimuli == "rest"

# extract the indices of the images corresponding to some condition or task
task_mask = np.logical_not(resting_state)

# find names of remaining active labels
categories = stimuli[task_mask].unique()

# extract tags indicating to which acquisition run a tag belongs
run_labels = labels["chunks"][task_mask]


# Load the fMRI data
# For decoding, standardizing is often very important
mask_filename = haxby_dataset.mask_vt[0]
func_filename = haxby_dataset.func[0]


# Because the data is in one single large 4D image, we need to use
# index_img to do the split easily.
from nilearn.image import index_img

fmri_niimgs = index_img(func_filename, task_mask)
classification_target = stimuli[task_mask]
[fetch_haxby] Dataset found in /home/runner/nilearn_data/haxby2001
First subject anatomical nifti image (3D) located is at: /home/runner/nilearn_data/haxby2001/subj2/anat.nii.gz
First subject functional nifti image (4D) is located at: /home/runner/nilearn_data/haxby2001/subj2/bold.nii.gz
Training the decoder
# Then we define the various classifiers that we use
classifiers = [
    "svc_l2",
    "svc_l1",
    "logistic_l1",
    "logistic_l2",
    "ridge_classifier",
]

# Here we compute prediction scores and run time for all these
# classifiers
import time

from sklearn.model_selection import LeaveOneGroupOut

from nilearn.decoding import Decoder

cv = LeaveOneGroupOut()
classifiers_data = {}

for classifier_name in sorted(classifiers):
    print(70 * "_")

    # The decoder has as default score the `roc_auc`
    decoder = Decoder(
        estimator=classifier_name,
        mask=mask_filename,
        standardize="zscore_sample",
        cv=cv,
        screening_percentile=100,
        verbose=1,
    )
    t0 = time.time()
    decoder.fit(
        fmri_niimgs,
        classification_target,
        groups=run_labels,
    )

    classifiers_data[classifier_name] = {"score": decoder.cv_scores_}
    print(f"{classifier_name:10}: {time.time() - t0:.2f}s")
    for category in categories:
        mean = np.mean(classifiers_data[classifier_name]["score"][category])
        std = np.std(classifiers_data[classifier_name]["score"][category])
        print(f"    {category:14} vs all -- AUC: {mean:1.2f} +- {std:1.2f}")

    # Adding the average performance per estimator
    scores = classifiers_data[classifier_name]["score"]
    scores["AVERAGE"] = np.mean(list(scores.values()), axis=0)
    classifiers_data[classifier_name]["score"] = scores
______________________________________________________________________
[Decoder.fit] Loading data from <nibabel.nifti1.Nifti1Image object at
0x7fd1592beef0>
[Decoder.fit] Loading mask from
'/home/runner/nilearn_data/haxby2001/subj2/mask4_vt.nii.gz'
/home/runner/work/nilearn/nilearn/examples/02_decoding/plot_haxby_different_estimators.py:102: UserWarning:

[NiftiMasker.fit] Generation of a mask has been requested (imgs != None) while a mask was given at masker creation. Given mask will be used.

[Decoder.fit] Resampling mask
[Decoder.fit] Finished fit
[Decoder.fit] Loading data from <nibabel.nifti1.Nifti1Image object at
0x7fd1592beef0>
[Decoder.fit] Extracting region signals
[Decoder.fit] Cleaning extracted signals
/home/runner/work/nilearn/nilearn/.tox/doc/lib/python3.10/site-packages/sklearn/linear_model/_logistic.py:1901: UserWarning:

l1_ratios parameter is only used when penalty is 'elasticnet'. Got (penalty=l2)

/home/runner/work/nilearn/nilearn/.tox/doc/lib/python3.10/site-packages/sklearn/linear_model/_logistic.py:1901: UserWarning:

l1_ratios parameter is only used when penalty is 'elasticnet'. Got (penalty=l2)

/home/runner/work/nilearn/nilearn/.tox/doc/lib/python3.10/site-packages/sklearn/linear_model/_logistic.py:1901: UserWarning:

l1_ratios parameter is only used when penalty is 'elasticnet'. Got (penalty=l2)

/home/runner/work/nilearn/nilearn/.tox/doc/lib/python3.10/site-packages/sklearn/linear_model/_logistic.py:1901: UserWarning:

l1_ratios parameter is only used when penalty is 'elasticnet'. Got (penalty=l2)

/home/runner/work/nilearn/nilearn/.tox/doc/lib/python3.10/site-packages/sklearn/linear_model/_logistic.py:1901: UserWarning:

l1_ratios parameter is only used when penalty is 'elasticnet'. Got (penalty=l2)

/home/runner/work/nilearn/nilearn/.tox/doc/lib/python3.10/site-packages/sklearn/linear_model/_logistic.py:1901: UserWarning:

l1_ratios parameter is only used when penalty is 'elasticnet'. Got (penalty=l2)

/home/runner/work/nilearn/nilearn/.tox/doc/lib/python3.10/site-packages/sklearn/linear_model/_logistic.py:1901: UserWarning:

l1_ratios parameter is only used when penalty is 'elasticnet'. Got (penalty=l2)

/home/runner/work/nilearn/nilearn/.tox/doc/lib/python3.10/site-packages/sklearn/linear_model/_logistic.py:1901: UserWarning:

l1_ratios parameter is only used when penalty is 'elasticnet'. Got (penalty=l2)

/home/runner/work/nilearn/nilearn/.tox/doc/lib/python3.10/site-packages/sklearn/linear_model/_logistic.py:1901: UserWarning:

l1_ratios parameter is only used when penalty is 'elasticnet'. Got (penalty=l2)

/home/runner/work/nilearn/nilearn/.tox/doc/lib/python3.10/site-packages/sklearn/linear_model/_logistic.py:1901: UserWarning:

l1_ratios parameter is only used when penalty is 'elasticnet'. Got (penalty=l2)

/home/runner/work/nilearn/nilearn/.tox/doc/lib/python3.10/site-packages/sklearn/linear_model/_logistic.py:1901: UserWarning:

l1_ratios parameter is only used when penalty is 'elasticnet'. Got (penalty=l2)

/home/runner/work/nilearn/nilearn/.tox/doc/lib/python3.10/site-packages/sklearn/linear_model/_logistic.py:1901: UserWarning:

l1_ratios parameter is only used when penalty is 'elasticnet'. Got (penalty=l2)

/home/runner/work/nilearn/nilearn/.tox/doc/lib/python3.10/site-packages/sklearn/linear_model/_logistic.py:1901: UserWarning:

l1_ratios parameter is only used when penalty is 'elasticnet'. Got (penalty=l2)

/home/runner/work/nilearn/nilearn/.tox/doc/lib/python3.10/site-packages/sklearn/linear_model/_logistic.py:1901: UserWarning:

l1_ratios parameter is only used when penalty is 'elasticnet'. Got (penalty=l2)

/home/runner/work/nilearn/nilearn/.tox/doc/lib/python3.10/site-packages/sklearn/linear_model/_logistic.py:1901: UserWarning:

l1_ratios parameter is only used when penalty is 'elasticnet'. Got (penalty=l2)

/home/runner/work/nilearn/nilearn/.tox/doc/lib/python3.10/site-packages/sklearn/linear_model/_logistic.py:1901: UserWarning:

l1_ratios parameter is only used when penalty is 'elasticnet'. Got (penalty=l2)

/home/runner/work/nilearn/nilearn/.tox/doc/lib/python3.10/site-packages/sklearn/linear_model/_logistic.py:1901: UserWarning:

l1_ratios parameter is only used when penalty is 'elasticnet'. Got (penalty=l2)

/home/runner/work/nilearn/nilearn/.tox/doc/lib/python3.10/site-packages/sklearn/linear_model/_logistic.py:1901: UserWarning:

l1_ratios parameter is only used when penalty is 'elasticnet'. Got (penalty=l2)

/home/runner/work/nilearn/nilearn/.tox/doc/lib/python3.10/site-packages/sklearn/linear_model/_logistic.py:1901: UserWarning:

l1_ratios parameter is only used when penalty is 'elasticnet'. Got (penalty=l2)

/home/runner/work/nilearn/nilearn/.tox/doc/lib/python3.10/site-packages/sklearn/linear_model/_logistic.py:1901: UserWarning:

l1_ratios parameter is only used when penalty is 'elasticnet'. Got (penalty=l2)

/home/runner/work/nilearn/nilearn/.tox/doc/lib/python3.10/site-packages/sklearn/linear_model/_logistic.py:1901: UserWarning:

l1_ratios parameter is only used when penalty is 'elasticnet'. Got (penalty=l2)

/home/runner/work/nilearn/nilearn/.tox/doc/lib/python3.10/site-packages/sklearn/linear_model/_logistic.py:1901: UserWarning:

l1_ratios parameter is only used when penalty is 'elasticnet'. Got (penalty=l2)

/home/runner/work/nilearn/nilearn/.tox/doc/lib/python3.10/site-packages/sklearn/linear_model/_logistic.py:1901: UserWarning:

l1_ratios parameter is only used when penalty is 'elasticnet'. Got (penalty=l2)

/home/runner/work/nilearn/nilearn/.tox/doc/lib/python3.10/site-packages/sklearn/linear_model/_logistic.py:1901: UserWarning:

l1_ratios parameter is only used when penalty is 'elasticnet'. Got (penalty=l2)

/home/runner/work/nilearn/nilearn/.tox/doc/lib/python3.10/site-packages/sklearn/linear_model/_logistic.py:1901: UserWarning:

l1_ratios parameter is only used when penalty is 'elasticnet'. Got (penalty=l2)

/home/runner/work/nilearn/nilearn/.tox/doc/lib/python3.10/site-packages/sklearn/linear_model/_logistic.py:1901: UserWarning:

l1_ratios parameter is only used when penalty is 'elasticnet'. Got (penalty=l2)

/home/runner/work/nilearn/nilearn/.tox/doc/lib/python3.10/site-packages/sklearn/linear_model/_logistic.py:1901: UserWarning:

l1_ratios parameter is only used when penalty is 'elasticnet'. Got (penalty=l2)

/home/runner/work/nilearn/nilearn/.tox/doc/lib/python3.10/site-packages/sklearn/linear_model/_logistic.py:1901: UserWarning:

l1_ratios parameter is only used when penalty is 'elasticnet'. Got (penalty=l2)

/home/runner/work/nilearn/nilearn/.tox/doc/lib/python3.10/site-packages/sklearn/linear_model/_logistic.py:1901: UserWarning:

l1_ratios parameter is only used when penalty is 'elasticnet'. Got (penalty=l2)

/home/runner/work/nilearn/nilearn/.tox/doc/lib/python3.10/site-packages/sklearn/linear_model/_logistic.py:1901: UserWarning:

l1_ratios parameter is only used when penalty is 'elasticnet'. Got (penalty=l2)

/home/runner/work/nilearn/nilearn/.tox/doc/lib/python3.10/site-packages/sklearn/linear_model/_logistic.py:1901: UserWarning:

l1_ratios parameter is only used when penalty is 'elasticnet'. Got (penalty=l2)

/home/runner/work/nilearn/nilearn/.tox/doc/lib/python3.10/site-packages/sklearn/linear_model/_logistic.py:1901: UserWarning:

l1_ratios parameter is only used when penalty is 'elasticnet'. Got (penalty=l2)

/home/runner/work/nilearn/nilearn/.tox/doc/lib/python3.10/site-packages/sklearn/linear_model/_logistic.py:1901: UserWarning:

l1_ratios parameter is only used when penalty is 'elasticnet'. Got (penalty=l2)

/home/runner/work/nilearn/nilearn/.tox/doc/lib/python3.10/site-packages/sklearn/linear_model/_logistic.py:1901: UserWarning:

l1_ratios parameter is only used when penalty is 'elasticnet'. Got (penalty=l2)

/home/runner/work/nilearn/nilearn/.tox/doc/lib/python3.10/site-packages/sklearn/linear_model/_logistic.py:1901: UserWarning:

l1_ratios parameter is only used when penalty is 'elasticnet'. Got (penalty=l2)

/home/runner/work/nilearn/nilearn/.tox/doc/lib/python3.10/site-packages/sklearn/linear_model/_logistic.py:1901: UserWarning:

l1_ratios parameter is only used when penalty is 'elasticnet'. Got (penalty=l2)

/home/runner/work/nilearn/nilearn/.tox/doc/lib/python3.10/site-packages/sklearn/linear_model/_logistic.py:1901: UserWarning:

l1_ratios parameter is only used when penalty is 'elasticnet'. Got (penalty=l2)

/home/runner/work/nilearn/nilearn/.tox/doc/lib/python3.10/site-packages/sklearn/linear_model/_logistic.py:1901: UserWarning:

l1_ratios parameter is only used when penalty is 'elasticnet'. Got (penalty=l2)

/home/runner/work/nilearn/nilearn/.tox/doc/lib/python3.10/site-packages/sklearn/linear_model/_logistic.py:1901: UserWarning:

l1_ratios parameter is only used when penalty is 'elasticnet'. Got (penalty=l2)

/home/runner/work/nilearn/nilearn/.tox/doc/lib/python3.10/site-packages/sklearn/linear_model/_logistic.py:1901: UserWarning:

l1_ratios parameter is only used when penalty is 'elasticnet'. Got (penalty=l2)

[Parallel(n_jobs=1)]: Done  40 tasks      | elapsed:  1.8min
/home/runner/work/nilearn/nilearn/.tox/doc/lib/python3.10/site-packages/sklearn/linear_model/_logistic.py:1901: UserWarning:

l1_ratios parameter is only used when penalty is 'elasticnet'. Got (penalty=l2)

/home/runner/work/nilearn/nilearn/.tox/doc/lib/python3.10/site-packages/sklearn/linear_model/_logistic.py:1901: UserWarning:

l1_ratios parameter is only used when penalty is 'elasticnet'. Got (penalty=l2)

/home/runner/work/nilearn/nilearn/.tox/doc/lib/python3.10/site-packages/sklearn/linear_model/_logistic.py:1901: UserWarning:

l1_ratios parameter is only used when penalty is 'elasticnet'. Got (penalty=l2)

/home/runner/work/nilearn/nilearn/.tox/doc/lib/python3.10/site-packages/sklearn/linear_model/_logistic.py:1901: UserWarning:

l1_ratios parameter is only used when penalty is 'elasticnet'. Got (penalty=l2)

/home/runner/work/nilearn/nilearn/.tox/doc/lib/python3.10/site-packages/sklearn/linear_model/_logistic.py:1901: UserWarning:

l1_ratios parameter is only used when penalty is 'elasticnet'. Got (penalty=l2)

/home/runner/work/nilearn/nilearn/.tox/doc/lib/python3.10/site-packages/sklearn/linear_model/_logistic.py:1901: UserWarning:

l1_ratios parameter is only used when penalty is 'elasticnet'. Got (penalty=l2)

/home/runner/work/nilearn/nilearn/.tox/doc/lib/python3.10/site-packages/sklearn/linear_model/_logistic.py:1901: UserWarning:

l1_ratios parameter is only used when penalty is 'elasticnet'. Got (penalty=l2)

/home/runner/work/nilearn/nilearn/.tox/doc/lib/python3.10/site-packages/sklearn/linear_model/_logistic.py:1901: UserWarning:

l1_ratios parameter is only used when penalty is 'elasticnet'. Got (penalty=l2)

/home/runner/work/nilearn/nilearn/.tox/doc/lib/python3.10/site-packages/sklearn/linear_model/_logistic.py:1901: UserWarning:

l1_ratios parameter is only used when penalty is 'elasticnet'. Got (penalty=l2)

/home/runner/work/nilearn/nilearn/.tox/doc/lib/python3.10/site-packages/sklearn/linear_model/_logistic.py:1901: UserWarning:

l1_ratios parameter is only used when penalty is 'elasticnet'. Got (penalty=l2)

/home/runner/work/nilearn/nilearn/.tox/doc/lib/python3.10/site-packages/sklearn/linear_model/_logistic.py:1901: UserWarning:

l1_ratios parameter is only used when penalty is 'elasticnet'. Got (penalty=l2)

/home/runner/work/nilearn/nilearn/.tox/doc/lib/python3.10/site-packages/sklearn/linear_model/_logistic.py:1901: UserWarning:

l1_ratios parameter is only used when penalty is 'elasticnet'. Got (penalty=l2)

/home/runner/work/nilearn/nilearn/.tox/doc/lib/python3.10/site-packages/sklearn/linear_model/_logistic.py:1901: UserWarning:

l1_ratios parameter is only used when penalty is 'elasticnet'. Got (penalty=l2)

/home/runner/work/nilearn/nilearn/.tox/doc/lib/python3.10/site-packages/sklearn/linear_model/_logistic.py:1901: UserWarning:

l1_ratios parameter is only used when penalty is 'elasticnet'. Got (penalty=l2)

/home/runner/work/nilearn/nilearn/.tox/doc/lib/python3.10/site-packages/sklearn/linear_model/_logistic.py:1901: UserWarning:

l1_ratios parameter is only used when penalty is 'elasticnet'. Got (penalty=l2)

/home/runner/work/nilearn/nilearn/.tox/doc/lib/python3.10/site-packages/sklearn/linear_model/_logistic.py:1901: UserWarning:

l1_ratios parameter is only used when penalty is 'elasticnet'. Got (penalty=l2)

/home/runner/work/nilearn/nilearn/.tox/doc/lib/python3.10/site-packages/sklearn/linear_model/_logistic.py:1901: UserWarning:

l1_ratios parameter is only used when penalty is 'elasticnet'. Got (penalty=l2)

/home/runner/work/nilearn/nilearn/.tox/doc/lib/python3.10/site-packages/sklearn/linear_model/_logistic.py:1901: UserWarning:

l1_ratios parameter is only used when penalty is 'elasticnet'. Got (penalty=l2)

/home/runner/work/nilearn/nilearn/.tox/doc/lib/python3.10/site-packages/sklearn/linear_model/_logistic.py:1901: UserWarning:

l1_ratios parameter is only used when penalty is 'elasticnet'. Got (penalty=l2)

/home/runner/work/nilearn/nilearn/.tox/doc/lib/python3.10/site-packages/sklearn/linear_model/_logistic.py:1901: UserWarning:

l1_ratios parameter is only used when penalty is 'elasticnet'. Got (penalty=l2)

/home/runner/work/nilearn/nilearn/.tox/doc/lib/python3.10/site-packages/sklearn/linear_model/_logistic.py:1901: UserWarning:

l1_ratios parameter is only used when penalty is 'elasticnet'. Got (penalty=l2)

/home/runner/work/nilearn/nilearn/.tox/doc/lib/python3.10/site-packages/sklearn/linear_model/_logistic.py:1901: UserWarning:

l1_ratios parameter is only used when penalty is 'elasticnet'. Got (penalty=l2)

/home/runner/work/nilearn/nilearn/.tox/doc/lib/python3.10/site-packages/sklearn/linear_model/_logistic.py:1901: UserWarning:

l1_ratios parameter is only used when penalty is 'elasticnet'. Got (penalty=l2)

/home/runner/work/nilearn/nilearn/.tox/doc/lib/python3.10/site-packages/sklearn/linear_model/_logistic.py:1901: UserWarning:

l1_ratios parameter is only used when penalty is 'elasticnet'. Got (penalty=l2)

/home/runner/work/nilearn/nilearn/.tox/doc/lib/python3.10/site-packages/sklearn/linear_model/_logistic.py:1901: UserWarning:

l1_ratios parameter is only used when penalty is 'elasticnet'. Got (penalty=l2)

/home/runner/work/nilearn/nilearn/.tox/doc/lib/python3.10/site-packages/sklearn/linear_model/_logistic.py:1901: UserWarning:

l1_ratios parameter is only used when penalty is 'elasticnet'. Got (penalty=l2)

/home/runner/work/nilearn/nilearn/.tox/doc/lib/python3.10/site-packages/sklearn/linear_model/_logistic.py:1901: UserWarning:

l1_ratios parameter is only used when penalty is 'elasticnet'. Got (penalty=l2)

/home/runner/work/nilearn/nilearn/.tox/doc/lib/python3.10/site-packages/sklearn/linear_model/_logistic.py:1901: UserWarning:

l1_ratios parameter is only used when penalty is 'elasticnet'. Got (penalty=l2)

/home/runner/work/nilearn/nilearn/.tox/doc/lib/python3.10/site-packages/sklearn/linear_model/_logistic.py:1901: UserWarning:

l1_ratios parameter is only used when penalty is 'elasticnet'. Got (penalty=l2)

/home/runner/work/nilearn/nilearn/.tox/doc/lib/python3.10/site-packages/sklearn/linear_model/_logistic.py:1901: UserWarning:

l1_ratios parameter is only used when penalty is 'elasticnet'. Got (penalty=l2)

/home/runner/work/nilearn/nilearn/.tox/doc/lib/python3.10/site-packages/sklearn/linear_model/_logistic.py:1901: UserWarning:

l1_ratios parameter is only used when penalty is 'elasticnet'. Got (penalty=l2)

/home/runner/work/nilearn/nilearn/.tox/doc/lib/python3.10/site-packages/sklearn/linear_model/_logistic.py:1901: UserWarning:

l1_ratios parameter is only used when penalty is 'elasticnet'. Got (penalty=l2)

/home/runner/work/nilearn/nilearn/.tox/doc/lib/python3.10/site-packages/sklearn/linear_model/_logistic.py:1901: UserWarning:

l1_ratios parameter is only used when penalty is 'elasticnet'. Got (penalty=l2)

/home/runner/work/nilearn/nilearn/.tox/doc/lib/python3.10/site-packages/sklearn/linear_model/_logistic.py:1901: UserWarning:

l1_ratios parameter is only used when penalty is 'elasticnet'. Got (penalty=l2)

/home/runner/work/nilearn/nilearn/.tox/doc/lib/python3.10/site-packages/sklearn/linear_model/_logistic.py:1901: UserWarning:

l1_ratios parameter is only used when penalty is 'elasticnet'. Got (penalty=l2)

/home/runner/work/nilearn/nilearn/.tox/doc/lib/python3.10/site-packages/sklearn/linear_model/_logistic.py:1901: UserWarning:

l1_ratios parameter is only used when penalty is 'elasticnet'. Got (penalty=l2)

/home/runner/work/nilearn/nilearn/.tox/doc/lib/python3.10/site-packages/sklearn/linear_model/_logistic.py:1901: UserWarning:

l1_ratios parameter is only used when penalty is 'elasticnet'. Got (penalty=l2)

/home/runner/work/nilearn/nilearn/.tox/doc/lib/python3.10/site-packages/sklearn/linear_model/_logistic.py:1901: UserWarning:

l1_ratios parameter is only used when penalty is 'elasticnet'. Got (penalty=l2)

/home/runner/work/nilearn/nilearn/.tox/doc/lib/python3.10/site-packages/sklearn/linear_model/_logistic.py:1901: UserWarning:

l1_ratios parameter is only used when penalty is 'elasticnet'. Got (penalty=l2)

/home/runner/work/nilearn/nilearn/.tox/doc/lib/python3.10/site-packages/sklearn/linear_model/_logistic.py:1901: UserWarning:

l1_ratios parameter is only used when penalty is 'elasticnet'. Got (penalty=l2)

/home/runner/work/nilearn/nilearn/.tox/doc/lib/python3.10/site-packages/sklearn/linear_model/_logistic.py:1901: UserWarning:

l1_ratios parameter is only used when penalty is 'elasticnet'. Got (penalty=l2)

/home/runner/work/nilearn/nilearn/.tox/doc/lib/python3.10/site-packages/sklearn/linear_model/_logistic.py:1901: UserWarning:

l1_ratios parameter is only used when penalty is 'elasticnet'. Got (penalty=l2)

/home/runner/work/nilearn/nilearn/.tox/doc/lib/python3.10/site-packages/sklearn/linear_model/_logistic.py:1901: UserWarning:

l1_ratios parameter is only used when penalty is 'elasticnet'. Got (penalty=l2)

/home/runner/work/nilearn/nilearn/.tox/doc/lib/python3.10/site-packages/sklearn/linear_model/_logistic.py:1901: UserWarning:

l1_ratios parameter is only used when penalty is 'elasticnet'. Got (penalty=l2)

/home/runner/work/nilearn/nilearn/.tox/doc/lib/python3.10/site-packages/sklearn/linear_model/_logistic.py:1901: UserWarning:

l1_ratios parameter is only used when penalty is 'elasticnet'. Got (penalty=l2)

/home/runner/work/nilearn/nilearn/.tox/doc/lib/python3.10/site-packages/sklearn/linear_model/_logistic.py:1901: UserWarning:

l1_ratios parameter is only used when penalty is 'elasticnet'. Got (penalty=l2)

/home/runner/work/nilearn/nilearn/.tox/doc/lib/python3.10/site-packages/sklearn/linear_model/_logistic.py:1901: UserWarning:

l1_ratios parameter is only used when penalty is 'elasticnet'. Got (penalty=l2)

/home/runner/work/nilearn/nilearn/.tox/doc/lib/python3.10/site-packages/sklearn/linear_model/_logistic.py:1901: UserWarning:

l1_ratios parameter is only used when penalty is 'elasticnet'. Got (penalty=l2)

/home/runner/work/nilearn/nilearn/.tox/doc/lib/python3.10/site-packages/sklearn/linear_model/_logistic.py:1901: UserWarning:

l1_ratios parameter is only used when penalty is 'elasticnet'. Got (penalty=l2)

/home/runner/work/nilearn/nilearn/.tox/doc/lib/python3.10/site-packages/sklearn/linear_model/_logistic.py:1901: UserWarning:

l1_ratios parameter is only used when penalty is 'elasticnet'. Got (penalty=l2)

/home/runner/work/nilearn/nilearn/.tox/doc/lib/python3.10/site-packages/sklearn/linear_model/_logistic.py:1901: UserWarning:

l1_ratios parameter is only used when penalty is 'elasticnet'. Got (penalty=l2)

/home/runner/work/nilearn/nilearn/.tox/doc/lib/python3.10/site-packages/sklearn/linear_model/_logistic.py:1901: UserWarning:

l1_ratios parameter is only used when penalty is 'elasticnet'. Got (penalty=l2)

/home/runner/work/nilearn/nilearn/.tox/doc/lib/python3.10/site-packages/sklearn/linear_model/_logistic.py:1901: UserWarning:

l1_ratios parameter is only used when penalty is 'elasticnet'. Got (penalty=l2)

/home/runner/work/nilearn/nilearn/.tox/doc/lib/python3.10/site-packages/sklearn/linear_model/_logistic.py:1901: UserWarning:

l1_ratios parameter is only used when penalty is 'elasticnet'. Got (penalty=l2)

/home/runner/work/nilearn/nilearn/.tox/doc/lib/python3.10/site-packages/sklearn/linear_model/_logistic.py:1901: UserWarning:

l1_ratios parameter is only used when penalty is 'elasticnet'. Got (penalty=l2)

/home/runner/work/nilearn/nilearn/.tox/doc/lib/python3.10/site-packages/sklearn/linear_model/_logistic.py:1901: UserWarning:

l1_ratios parameter is only used when penalty is 'elasticnet'. Got (penalty=l2)

[Parallel(n_jobs=1)]: Done  96 out of  96 | elapsed:  4.1min finished
[Decoder.fit] Computing image from signals
[Decoder.fit] Computing image from signals
[Decoder.fit] Computing image from signals
[Decoder.fit] Computing image from signals
[Decoder.fit] Computing image from signals
[Decoder.fit] Computing image from signals
[Decoder.fit] Computing image from signals
[Decoder.fit] Computing image from signals
[Decoder.fit] Computing image from signals
[Decoder.fit] Computing image from signals
[Decoder.fit] Computing image from signals
[Decoder.fit] Computing image from signals
[Decoder.fit] Computing image from signals
[Decoder.fit] Computing image from signals
[Decoder.fit] Computing image from signals
[Decoder.fit] Computing image from signals
logistic_l1: 250.64s
    scissors       vs all -- AUC: 0.90 +- 0.08
    face           vs all -- AUC: 0.97 +- 0.04
    cat            vs all -- AUC: 0.96 +- 0.04
    shoe           vs all -- AUC: 0.91 +- 0.08
    house          vs all -- AUC: 1.00 +- 0.00
    scrambledpix   vs all -- AUC: 0.97 +- 0.08
    bottle         vs all -- AUC: 0.82 +- 0.17
    chair          vs all -- AUC: 0.87 +- 0.17
______________________________________________________________________
[Decoder.fit] Loading data from <nibabel.nifti1.Nifti1Image object at
0x7fd1592beef0>
[Decoder.fit] Loading mask from
'/home/runner/nilearn_data/haxby2001/subj2/mask4_vt.nii.gz'
/home/runner/work/nilearn/nilearn/examples/02_decoding/plot_haxby_different_estimators.py:102: UserWarning:

[NiftiMasker.fit] Generation of a mask has been requested (imgs != None) while a mask was given at masker creation. Given mask will be used.

[Decoder.fit] Resampling mask
[Decoder.fit] Finished fit
[Decoder.fit] Loading data from <nibabel.nifti1.Nifti1Image object at
0x7fd1592beef0>
[Decoder.fit] Extracting region signals
[Decoder.fit] Cleaning extracted signals
/home/runner/work/nilearn/nilearn/.tox/doc/lib/python3.10/site-packages/sklearn/linear_model/_logistic.py:1901: UserWarning:

l1_ratios parameter is only used when penalty is 'elasticnet'. Got (penalty=l2)

/home/runner/work/nilearn/nilearn/.tox/doc/lib/python3.10/site-packages/sklearn/linear_model/_logistic.py:1901: UserWarning:

l1_ratios parameter is only used when penalty is 'elasticnet'. Got (penalty=l2)

/home/runner/work/nilearn/nilearn/.tox/doc/lib/python3.10/site-packages/sklearn/linear_model/_logistic.py:1901: UserWarning:

l1_ratios parameter is only used when penalty is 'elasticnet'. Got (penalty=l2)

/home/runner/work/nilearn/nilearn/.tox/doc/lib/python3.10/site-packages/sklearn/linear_model/_logistic.py:1901: UserWarning:

l1_ratios parameter is only used when penalty is 'elasticnet'. Got (penalty=l2)

/home/runner/work/nilearn/nilearn/.tox/doc/lib/python3.10/site-packages/sklearn/linear_model/_logistic.py:1901: UserWarning:

l1_ratios parameter is only used when penalty is 'elasticnet'. Got (penalty=l2)

/home/runner/work/nilearn/nilearn/.tox/doc/lib/python3.10/site-packages/sklearn/linear_model/_logistic.py:1901: UserWarning:

l1_ratios parameter is only used when penalty is 'elasticnet'. Got (penalty=l2)

/home/runner/work/nilearn/nilearn/.tox/doc/lib/python3.10/site-packages/sklearn/linear_model/_logistic.py:1901: UserWarning:

l1_ratios parameter is only used when penalty is 'elasticnet'. Got (penalty=l2)

/home/runner/work/nilearn/nilearn/.tox/doc/lib/python3.10/site-packages/sklearn/linear_model/_logistic.py:1901: UserWarning:

l1_ratios parameter is only used when penalty is 'elasticnet'. Got (penalty=l2)

/home/runner/work/nilearn/nilearn/.tox/doc/lib/python3.10/site-packages/sklearn/linear_model/_logistic.py:1901: UserWarning:

l1_ratios parameter is only used when penalty is 'elasticnet'. Got (penalty=l2)

/home/runner/work/nilearn/nilearn/.tox/doc/lib/python3.10/site-packages/sklearn/linear_model/_logistic.py:1901: UserWarning:

l1_ratios parameter is only used when penalty is 'elasticnet'. Got (penalty=l2)

/home/runner/work/nilearn/nilearn/.tox/doc/lib/python3.10/site-packages/sklearn/linear_model/_logistic.py:1901: UserWarning:

l1_ratios parameter is only used when penalty is 'elasticnet'. Got (penalty=l2)

/home/runner/work/nilearn/nilearn/.tox/doc/lib/python3.10/site-packages/sklearn/linear_model/_logistic.py:1901: UserWarning:

l1_ratios parameter is only used when penalty is 'elasticnet'. Got (penalty=l2)

/home/runner/work/nilearn/nilearn/.tox/doc/lib/python3.10/site-packages/sklearn/linear_model/_logistic.py:1901: UserWarning:

l1_ratios parameter is only used when penalty is 'elasticnet'. Got (penalty=l2)

/home/runner/work/nilearn/nilearn/.tox/doc/lib/python3.10/site-packages/sklearn/linear_model/_logistic.py:1901: UserWarning:

l1_ratios parameter is only used when penalty is 'elasticnet'. Got (penalty=l2)

/home/runner/work/nilearn/nilearn/.tox/doc/lib/python3.10/site-packages/sklearn/linear_model/_logistic.py:1901: UserWarning:

l1_ratios parameter is only used when penalty is 'elasticnet'. Got (penalty=l2)

/home/runner/work/nilearn/nilearn/.tox/doc/lib/python3.10/site-packages/sklearn/linear_model/_logistic.py:1901: UserWarning:

l1_ratios parameter is only used when penalty is 'elasticnet'. Got (penalty=l2)

/home/runner/work/nilearn/nilearn/.tox/doc/lib/python3.10/site-packages/sklearn/linear_model/_logistic.py:1901: UserWarning:

l1_ratios parameter is only used when penalty is 'elasticnet'. Got (penalty=l2)

/home/runner/work/nilearn/nilearn/.tox/doc/lib/python3.10/site-packages/sklearn/linear_model/_logistic.py:1901: UserWarning:

l1_ratios parameter is only used when penalty is 'elasticnet'. Got (penalty=l2)

/home/runner/work/nilearn/nilearn/.tox/doc/lib/python3.10/site-packages/sklearn/linear_model/_logistic.py:1901: UserWarning:

l1_ratios parameter is only used when penalty is 'elasticnet'. Got (penalty=l2)

/home/runner/work/nilearn/nilearn/.tox/doc/lib/python3.10/site-packages/sklearn/linear_model/_logistic.py:1901: UserWarning:

l1_ratios parameter is only used when penalty is 'elasticnet'. Got (penalty=l2)

/home/runner/work/nilearn/nilearn/.tox/doc/lib/python3.10/site-packages/sklearn/linear_model/_logistic.py:1901: UserWarning:

l1_ratios parameter is only used when penalty is 'elasticnet'. Got (penalty=l2)

/home/runner/work/nilearn/nilearn/.tox/doc/lib/python3.10/site-packages/sklearn/linear_model/_logistic.py:1901: UserWarning:

l1_ratios parameter is only used when penalty is 'elasticnet'. Got (penalty=l2)

/home/runner/work/nilearn/nilearn/.tox/doc/lib/python3.10/site-packages/sklearn/linear_model/_logistic.py:1901: UserWarning:

l1_ratios parameter is only used when penalty is 'elasticnet'. Got (penalty=l2)

/home/runner/work/nilearn/nilearn/.tox/doc/lib/python3.10/site-packages/sklearn/linear_model/_logistic.py:1901: UserWarning:

l1_ratios parameter is only used when penalty is 'elasticnet'. Got (penalty=l2)

/home/runner/work/nilearn/nilearn/.tox/doc/lib/python3.10/site-packages/sklearn/linear_model/_logistic.py:1901: UserWarning:

l1_ratios parameter is only used when penalty is 'elasticnet'. Got (penalty=l2)

/home/runner/work/nilearn/nilearn/.tox/doc/lib/python3.10/site-packages/sklearn/linear_model/_logistic.py:1901: UserWarning:

l1_ratios parameter is only used when penalty is 'elasticnet'. Got (penalty=l2)

/home/runner/work/nilearn/nilearn/.tox/doc/lib/python3.10/site-packages/sklearn/linear_model/_logistic.py:1901: UserWarning:

l1_ratios parameter is only used when penalty is 'elasticnet'. Got (penalty=l2)

/home/runner/work/nilearn/nilearn/.tox/doc/lib/python3.10/site-packages/sklearn/linear_model/_logistic.py:1901: UserWarning:

l1_ratios parameter is only used when penalty is 'elasticnet'. Got (penalty=l2)

/home/runner/work/nilearn/nilearn/.tox/doc/lib/python3.10/site-packages/sklearn/linear_model/_logistic.py:1901: UserWarning:

l1_ratios parameter is only used when penalty is 'elasticnet'. Got (penalty=l2)

/home/runner/work/nilearn/nilearn/.tox/doc/lib/python3.10/site-packages/sklearn/linear_model/_logistic.py:1901: UserWarning:

l1_ratios parameter is only used when penalty is 'elasticnet'. Got (penalty=l2)

/home/runner/work/nilearn/nilearn/.tox/doc/lib/python3.10/site-packages/sklearn/linear_model/_logistic.py:1901: UserWarning:

l1_ratios parameter is only used when penalty is 'elasticnet'. Got (penalty=l2)

/home/runner/work/nilearn/nilearn/.tox/doc/lib/python3.10/site-packages/sklearn/linear_model/_logistic.py:1901: UserWarning:

l1_ratios parameter is only used when penalty is 'elasticnet'. Got (penalty=l2)

/home/runner/work/nilearn/nilearn/.tox/doc/lib/python3.10/site-packages/sklearn/linear_model/_logistic.py:1901: UserWarning:

l1_ratios parameter is only used when penalty is 'elasticnet'. Got (penalty=l2)

/home/runner/work/nilearn/nilearn/.tox/doc/lib/python3.10/site-packages/sklearn/linear_model/_logistic.py:1901: UserWarning:

l1_ratios parameter is only used when penalty is 'elasticnet'. Got (penalty=l2)

/home/runner/work/nilearn/nilearn/.tox/doc/lib/python3.10/site-packages/sklearn/linear_model/_logistic.py:1901: UserWarning:

l1_ratios parameter is only used when penalty is 'elasticnet'. Got (penalty=l2)

/home/runner/work/nilearn/nilearn/.tox/doc/lib/python3.10/site-packages/sklearn/linear_model/_logistic.py:1901: UserWarning:

l1_ratios parameter is only used when penalty is 'elasticnet'. Got (penalty=l2)

/home/runner/work/nilearn/nilearn/.tox/doc/lib/python3.10/site-packages/sklearn/linear_model/_logistic.py:1901: UserWarning:

l1_ratios parameter is only used when penalty is 'elasticnet'. Got (penalty=l2)

/home/runner/work/nilearn/nilearn/.tox/doc/lib/python3.10/site-packages/sklearn/linear_model/_logistic.py:1901: UserWarning:

l1_ratios parameter is only used when penalty is 'elasticnet'. Got (penalty=l2)

/home/runner/work/nilearn/nilearn/.tox/doc/lib/python3.10/site-packages/sklearn/linear_model/_logistic.py:1901: UserWarning:

l1_ratios parameter is only used when penalty is 'elasticnet'. Got (penalty=l2)

/home/runner/work/nilearn/nilearn/.tox/doc/lib/python3.10/site-packages/sklearn/linear_model/_logistic.py:1901: UserWarning:

l1_ratios parameter is only used when penalty is 'elasticnet'. Got (penalty=l2)

[Parallel(n_jobs=1)]: Done  40 tasks      | elapsed:  1.8min
/home/runner/work/nilearn/nilearn/.tox/doc/lib/python3.10/site-packages/sklearn/linear_model/_logistic.py:1901: UserWarning:

l1_ratios parameter is only used when penalty is 'elasticnet'. Got (penalty=l2)

/home/runner/work/nilearn/nilearn/.tox/doc/lib/python3.10/site-packages/sklearn/linear_model/_logistic.py:1901: UserWarning:

l1_ratios parameter is only used when penalty is 'elasticnet'. Got (penalty=l2)

/home/runner/work/nilearn/nilearn/.tox/doc/lib/python3.10/site-packages/sklearn/linear_model/_logistic.py:1901: UserWarning:

l1_ratios parameter is only used when penalty is 'elasticnet'. Got (penalty=l2)

/home/runner/work/nilearn/nilearn/.tox/doc/lib/python3.10/site-packages/sklearn/linear_model/_logistic.py:1901: UserWarning:

l1_ratios parameter is only used when penalty is 'elasticnet'. Got (penalty=l2)

/home/runner/work/nilearn/nilearn/.tox/doc/lib/python3.10/site-packages/sklearn/linear_model/_logistic.py:1901: UserWarning:

l1_ratios parameter is only used when penalty is 'elasticnet'. Got (penalty=l2)

/home/runner/work/nilearn/nilearn/.tox/doc/lib/python3.10/site-packages/sklearn/linear_model/_logistic.py:1901: UserWarning:

l1_ratios parameter is only used when penalty is 'elasticnet'. Got (penalty=l2)

/home/runner/work/nilearn/nilearn/.tox/doc/lib/python3.10/site-packages/sklearn/linear_model/_logistic.py:1901: UserWarning:

l1_ratios parameter is only used when penalty is 'elasticnet'. Got (penalty=l2)

/home/runner/work/nilearn/nilearn/.tox/doc/lib/python3.10/site-packages/sklearn/linear_model/_logistic.py:1901: UserWarning:

l1_ratios parameter is only used when penalty is 'elasticnet'. Got (penalty=l2)

/home/runner/work/nilearn/nilearn/.tox/doc/lib/python3.10/site-packages/sklearn/linear_model/_logistic.py:1901: UserWarning:

l1_ratios parameter is only used when penalty is 'elasticnet'. Got (penalty=l2)

/home/runner/work/nilearn/nilearn/.tox/doc/lib/python3.10/site-packages/sklearn/linear_model/_logistic.py:1901: UserWarning:

l1_ratios parameter is only used when penalty is 'elasticnet'. Got (penalty=l2)

/home/runner/work/nilearn/nilearn/.tox/doc/lib/python3.10/site-packages/sklearn/linear_model/_logistic.py:1901: UserWarning:

l1_ratios parameter is only used when penalty is 'elasticnet'. Got (penalty=l2)

/home/runner/work/nilearn/nilearn/.tox/doc/lib/python3.10/site-packages/sklearn/linear_model/_logistic.py:1901: UserWarning:

l1_ratios parameter is only used when penalty is 'elasticnet'. Got (penalty=l2)

/home/runner/work/nilearn/nilearn/.tox/doc/lib/python3.10/site-packages/sklearn/linear_model/_logistic.py:1901: UserWarning:

l1_ratios parameter is only used when penalty is 'elasticnet'. Got (penalty=l2)

/home/runner/work/nilearn/nilearn/.tox/doc/lib/python3.10/site-packages/sklearn/linear_model/_logistic.py:1901: UserWarning:

l1_ratios parameter is only used when penalty is 'elasticnet'. Got (penalty=l2)

/home/runner/work/nilearn/nilearn/.tox/doc/lib/python3.10/site-packages/sklearn/linear_model/_logistic.py:1901: UserWarning:

l1_ratios parameter is only used when penalty is 'elasticnet'. Got (penalty=l2)

/home/runner/work/nilearn/nilearn/.tox/doc/lib/python3.10/site-packages/sklearn/linear_model/_logistic.py:1901: UserWarning:

l1_ratios parameter is only used when penalty is 'elasticnet'. Got (penalty=l2)

/home/runner/work/nilearn/nilearn/.tox/doc/lib/python3.10/site-packages/sklearn/linear_model/_logistic.py:1901: UserWarning:

l1_ratios parameter is only used when penalty is 'elasticnet'. Got (penalty=l2)

/home/runner/work/nilearn/nilearn/.tox/doc/lib/python3.10/site-packages/sklearn/linear_model/_logistic.py:1901: UserWarning:

l1_ratios parameter is only used when penalty is 'elasticnet'. Got (penalty=l2)

/home/runner/work/nilearn/nilearn/.tox/doc/lib/python3.10/site-packages/sklearn/linear_model/_logistic.py:1901: UserWarning:

l1_ratios parameter is only used when penalty is 'elasticnet'. Got (penalty=l2)

/home/runner/work/nilearn/nilearn/.tox/doc/lib/python3.10/site-packages/sklearn/linear_model/_logistic.py:1901: UserWarning:

l1_ratios parameter is only used when penalty is 'elasticnet'. Got (penalty=l2)

/home/runner/work/nilearn/nilearn/.tox/doc/lib/python3.10/site-packages/sklearn/linear_model/_logistic.py:1901: UserWarning:

l1_ratios parameter is only used when penalty is 'elasticnet'. Got (penalty=l2)

/home/runner/work/nilearn/nilearn/.tox/doc/lib/python3.10/site-packages/sklearn/linear_model/_logistic.py:1901: UserWarning:

l1_ratios parameter is only used when penalty is 'elasticnet'. Got (penalty=l2)

/home/runner/work/nilearn/nilearn/.tox/doc/lib/python3.10/site-packages/sklearn/linear_model/_logistic.py:1901: UserWarning:

l1_ratios parameter is only used when penalty is 'elasticnet'. Got (penalty=l2)

/home/runner/work/nilearn/nilearn/.tox/doc/lib/python3.10/site-packages/sklearn/linear_model/_logistic.py:1901: UserWarning:

l1_ratios parameter is only used when penalty is 'elasticnet'. Got (penalty=l2)

/home/runner/work/nilearn/nilearn/.tox/doc/lib/python3.10/site-packages/sklearn/linear_model/_logistic.py:1901: UserWarning:

l1_ratios parameter is only used when penalty is 'elasticnet'. Got (penalty=l2)

/home/runner/work/nilearn/nilearn/.tox/doc/lib/python3.10/site-packages/sklearn/linear_model/_logistic.py:1901: UserWarning:

l1_ratios parameter is only used when penalty is 'elasticnet'. Got (penalty=l2)

/home/runner/work/nilearn/nilearn/.tox/doc/lib/python3.10/site-packages/sklearn/linear_model/_logistic.py:1901: UserWarning:

l1_ratios parameter is only used when penalty is 'elasticnet'. Got (penalty=l2)

/home/runner/work/nilearn/nilearn/.tox/doc/lib/python3.10/site-packages/sklearn/linear_model/_logistic.py:1901: UserWarning:

l1_ratios parameter is only used when penalty is 'elasticnet'. Got (penalty=l2)

/home/runner/work/nilearn/nilearn/.tox/doc/lib/python3.10/site-packages/sklearn/linear_model/_logistic.py:1901: UserWarning:

l1_ratios parameter is only used when penalty is 'elasticnet'. Got (penalty=l2)

/home/runner/work/nilearn/nilearn/.tox/doc/lib/python3.10/site-packages/sklearn/linear_model/_logistic.py:1901: UserWarning:

l1_ratios parameter is only used when penalty is 'elasticnet'. Got (penalty=l2)

/home/runner/work/nilearn/nilearn/.tox/doc/lib/python3.10/site-packages/sklearn/linear_model/_logistic.py:1901: UserWarning:

l1_ratios parameter is only used when penalty is 'elasticnet'. Got (penalty=l2)

/home/runner/work/nilearn/nilearn/.tox/doc/lib/python3.10/site-packages/sklearn/linear_model/_logistic.py:1901: UserWarning:

l1_ratios parameter is only used when penalty is 'elasticnet'. Got (penalty=l2)

/home/runner/work/nilearn/nilearn/.tox/doc/lib/python3.10/site-packages/sklearn/linear_model/_logistic.py:1901: UserWarning:

l1_ratios parameter is only used when penalty is 'elasticnet'. Got (penalty=l2)

/home/runner/work/nilearn/nilearn/.tox/doc/lib/python3.10/site-packages/sklearn/linear_model/_logistic.py:1901: UserWarning:

l1_ratios parameter is only used when penalty is 'elasticnet'. Got (penalty=l2)

/home/runner/work/nilearn/nilearn/.tox/doc/lib/python3.10/site-packages/sklearn/linear_model/_logistic.py:1901: UserWarning:

l1_ratios parameter is only used when penalty is 'elasticnet'. Got (penalty=l2)

/home/runner/work/nilearn/nilearn/.tox/doc/lib/python3.10/site-packages/sklearn/linear_model/_logistic.py:1901: UserWarning:

l1_ratios parameter is only used when penalty is 'elasticnet'. Got (penalty=l2)

/home/runner/work/nilearn/nilearn/.tox/doc/lib/python3.10/site-packages/sklearn/linear_model/_logistic.py:1901: UserWarning:

l1_ratios parameter is only used when penalty is 'elasticnet'. Got (penalty=l2)

/home/runner/work/nilearn/nilearn/.tox/doc/lib/python3.10/site-packages/sklearn/linear_model/_logistic.py:1901: UserWarning:

l1_ratios parameter is only used when penalty is 'elasticnet'. Got (penalty=l2)

/home/runner/work/nilearn/nilearn/.tox/doc/lib/python3.10/site-packages/sklearn/linear_model/_logistic.py:1901: UserWarning:

l1_ratios parameter is only used when penalty is 'elasticnet'. Got (penalty=l2)

/home/runner/work/nilearn/nilearn/.tox/doc/lib/python3.10/site-packages/sklearn/linear_model/_logistic.py:1901: UserWarning:

l1_ratios parameter is only used when penalty is 'elasticnet'. Got (penalty=l2)

/home/runner/work/nilearn/nilearn/.tox/doc/lib/python3.10/site-packages/sklearn/linear_model/_logistic.py:1901: UserWarning:

l1_ratios parameter is only used when penalty is 'elasticnet'. Got (penalty=l2)

/home/runner/work/nilearn/nilearn/.tox/doc/lib/python3.10/site-packages/sklearn/linear_model/_logistic.py:1901: UserWarning:

l1_ratios parameter is only used when penalty is 'elasticnet'. Got (penalty=l2)

/home/runner/work/nilearn/nilearn/.tox/doc/lib/python3.10/site-packages/sklearn/linear_model/_logistic.py:1901: UserWarning:

l1_ratios parameter is only used when penalty is 'elasticnet'. Got (penalty=l2)

/home/runner/work/nilearn/nilearn/.tox/doc/lib/python3.10/site-packages/sklearn/linear_model/_logistic.py:1901: UserWarning:

l1_ratios parameter is only used when penalty is 'elasticnet'. Got (penalty=l2)

/home/runner/work/nilearn/nilearn/.tox/doc/lib/python3.10/site-packages/sklearn/linear_model/_logistic.py:1901: UserWarning:

l1_ratios parameter is only used when penalty is 'elasticnet'. Got (penalty=l2)

/home/runner/work/nilearn/nilearn/.tox/doc/lib/python3.10/site-packages/sklearn/linear_model/_logistic.py:1901: UserWarning:

l1_ratios parameter is only used when penalty is 'elasticnet'. Got (penalty=l2)

/home/runner/work/nilearn/nilearn/.tox/doc/lib/python3.10/site-packages/sklearn/linear_model/_logistic.py:1901: UserWarning:

l1_ratios parameter is only used when penalty is 'elasticnet'. Got (penalty=l2)

/home/runner/work/nilearn/nilearn/.tox/doc/lib/python3.10/site-packages/sklearn/linear_model/_logistic.py:1901: UserWarning:

l1_ratios parameter is only used when penalty is 'elasticnet'. Got (penalty=l2)

/home/runner/work/nilearn/nilearn/.tox/doc/lib/python3.10/site-packages/sklearn/linear_model/_logistic.py:1901: UserWarning:

l1_ratios parameter is only used when penalty is 'elasticnet'. Got (penalty=l2)

/home/runner/work/nilearn/nilearn/.tox/doc/lib/python3.10/site-packages/sklearn/linear_model/_logistic.py:1901: UserWarning:

l1_ratios parameter is only used when penalty is 'elasticnet'. Got (penalty=l2)

/home/runner/work/nilearn/nilearn/.tox/doc/lib/python3.10/site-packages/sklearn/linear_model/_logistic.py:1901: UserWarning:

l1_ratios parameter is only used when penalty is 'elasticnet'. Got (penalty=l2)

/home/runner/work/nilearn/nilearn/.tox/doc/lib/python3.10/site-packages/sklearn/linear_model/_logistic.py:1901: UserWarning:

l1_ratios parameter is only used when penalty is 'elasticnet'. Got (penalty=l2)

/home/runner/work/nilearn/nilearn/.tox/doc/lib/python3.10/site-packages/sklearn/linear_model/_logistic.py:1901: UserWarning:

l1_ratios parameter is only used when penalty is 'elasticnet'. Got (penalty=l2)

/home/runner/work/nilearn/nilearn/.tox/doc/lib/python3.10/site-packages/sklearn/linear_model/_logistic.py:1901: UserWarning:

l1_ratios parameter is only used when penalty is 'elasticnet'. Got (penalty=l2)

/home/runner/work/nilearn/nilearn/.tox/doc/lib/python3.10/site-packages/sklearn/linear_model/_logistic.py:1901: UserWarning:

l1_ratios parameter is only used when penalty is 'elasticnet'. Got (penalty=l2)

/home/runner/work/nilearn/nilearn/.tox/doc/lib/python3.10/site-packages/sklearn/linear_model/_logistic.py:1901: UserWarning:

l1_ratios parameter is only used when penalty is 'elasticnet'. Got (penalty=l2)

[Parallel(n_jobs=1)]: Done  96 out of  96 | elapsed:  4.1min finished
[Decoder.fit] Computing image from signals
[Decoder.fit] Computing image from signals
[Decoder.fit] Computing image from signals
[Decoder.fit] Computing image from signals
[Decoder.fit] Computing image from signals
[Decoder.fit] Computing image from signals
[Decoder.fit] Computing image from signals
[Decoder.fit] Computing image from signals
[Decoder.fit] Computing image from signals
[Decoder.fit] Computing image from signals
[Decoder.fit] Computing image from signals
[Decoder.fit] Computing image from signals
[Decoder.fit] Computing image from signals
[Decoder.fit] Computing image from signals
[Decoder.fit] Computing image from signals
[Decoder.fit] Computing image from signals
logistic_l2: 248.96s
    scissors       vs all -- AUC: 0.90 +- 0.08
    face           vs all -- AUC: 0.97 +- 0.04
    cat            vs all -- AUC: 0.96 +- 0.04
    shoe           vs all -- AUC: 0.91 +- 0.08
    house          vs all -- AUC: 1.00 +- 0.00
    scrambledpix   vs all -- AUC: 0.97 +- 0.08
    bottle         vs all -- AUC: 0.82 +- 0.17
    chair          vs all -- AUC: 0.87 +- 0.17
______________________________________________________________________
[Decoder.fit] Loading data from <nibabel.nifti1.Nifti1Image object at
0x7fd1592beef0>
[Decoder.fit] Loading mask from
'/home/runner/nilearn_data/haxby2001/subj2/mask4_vt.nii.gz'
/home/runner/work/nilearn/nilearn/examples/02_decoding/plot_haxby_different_estimators.py:102: UserWarning:

[NiftiMasker.fit] Generation of a mask has been requested (imgs != None) while a mask was given at masker creation. Given mask will be used.

[Decoder.fit] Resampling mask
[Decoder.fit] Finished fit
[Decoder.fit] Loading data from <nibabel.nifti1.Nifti1Image object at
0x7fd1592beef0>
[Decoder.fit] Extracting region signals
[Decoder.fit] Cleaning extracted signals
[Parallel(n_jobs=1)]: Done  40 tasks      | elapsed:    4.2s
[Parallel(n_jobs=1)]: Done  96 out of  96 | elapsed:   10.0s finished
[Decoder.fit] Computing image from signals
[Decoder.fit] Computing image from signals
[Decoder.fit] Computing image from signals
[Decoder.fit] Computing image from signals
[Decoder.fit] Computing image from signals
[Decoder.fit] Computing image from signals
[Decoder.fit] Computing image from signals
[Decoder.fit] Computing image from signals
[Decoder.fit] Computing image from signals
[Decoder.fit] Computing image from signals
[Decoder.fit] Computing image from signals
[Decoder.fit] Computing image from signals
[Decoder.fit] Computing image from signals
[Decoder.fit] Computing image from signals
[Decoder.fit] Computing image from signals
[Decoder.fit] Computing image from signals
ridge_classifier: 14.28s
    scissors       vs all -- AUC: 0.94 +- 0.05
    face           vs all -- AUC: 0.98 +- 0.02
    cat            vs all -- AUC: 0.95 +- 0.04
    shoe           vs all -- AUC: 0.94 +- 0.07
    house          vs all -- AUC: 1.00 +- 0.00
    scrambledpix   vs all -- AUC: 1.00 +- 0.00
    bottle         vs all -- AUC: 0.89 +- 0.09
    chair          vs all -- AUC: 0.93 +- 0.07
______________________________________________________________________
[Decoder.fit] Loading data from <nibabel.nifti1.Nifti1Image object at
0x7fd1592beef0>
[Decoder.fit] Loading mask from
'/home/runner/nilearn_data/haxby2001/subj2/mask4_vt.nii.gz'
/home/runner/work/nilearn/nilearn/examples/02_decoding/plot_haxby_different_estimators.py:102: UserWarning:

[NiftiMasker.fit] Generation of a mask has been requested (imgs != None) while a mask was given at masker creation. Given mask will be used.

[Decoder.fit] Resampling mask
[Decoder.fit] Finished fit
[Decoder.fit] Loading data from <nibabel.nifti1.Nifti1Image object at
0x7fd1592beef0>
[Decoder.fit] Extracting region signals
[Decoder.fit] Cleaning extracted signals
[Parallel(n_jobs=1)]: Done  40 tasks      | elapsed:    9.1s
[Parallel(n_jobs=1)]: Done  96 out of  96 | elapsed:   17.9s finished
[Decoder.fit] Computing image from signals
[Decoder.fit] Computing image from signals
[Decoder.fit] Computing image from signals
[Decoder.fit] Computing image from signals
[Decoder.fit] Computing image from signals
[Decoder.fit] Computing image from signals
[Decoder.fit] Computing image from signals
[Decoder.fit] Computing image from signals
[Decoder.fit] Computing image from signals
[Decoder.fit] Computing image from signals
[Decoder.fit] Computing image from signals
[Decoder.fit] Computing image from signals
[Decoder.fit] Computing image from signals
[Decoder.fit] Computing image from signals
[Decoder.fit] Computing image from signals
[Decoder.fit] Computing image from signals
svc_l1    : 22.12s
    scissors       vs all -- AUC: 0.92 +- 0.05
    face           vs all -- AUC: 0.98 +- 0.03
    cat            vs all -- AUC: 0.96 +- 0.04
    shoe           vs all -- AUC: 0.92 +- 0.07
    house          vs all -- AUC: 1.00 +- 0.00
    scrambledpix   vs all -- AUC: 0.99 +- 0.01
    bottle         vs all -- AUC: 0.89 +- 0.08
    chair          vs all -- AUC: 0.93 +- 0.04
______________________________________________________________________
[Decoder.fit] Loading data from <nibabel.nifti1.Nifti1Image object at
0x7fd1592beef0>
[Decoder.fit] Loading mask from
'/home/runner/nilearn_data/haxby2001/subj2/mask4_vt.nii.gz'
/home/runner/work/nilearn/nilearn/examples/02_decoding/plot_haxby_different_estimators.py:102: UserWarning:

[NiftiMasker.fit] Generation of a mask has been requested (imgs != None) while a mask was given at masker creation. Given mask will be used.

[Decoder.fit] Resampling mask
[Decoder.fit] Finished fit
[Decoder.fit] Loading data from <nibabel.nifti1.Nifti1Image object at
0x7fd1592beef0>
[Decoder.fit] Extracting region signals
[Decoder.fit] Cleaning extracted signals
[Parallel(n_jobs=1)]: Done  40 tasks      | elapsed:   25.5s
[Parallel(n_jobs=1)]: Done  96 out of  96 | elapsed:   53.7s finished
[Decoder.fit] Computing image from signals
[Decoder.fit] Computing image from signals
[Decoder.fit] Computing image from signals
[Decoder.fit] Computing image from signals
[Decoder.fit] Computing image from signals
[Decoder.fit] Computing image from signals
[Decoder.fit] Computing image from signals
[Decoder.fit] Computing image from signals
[Decoder.fit] Computing image from signals
[Decoder.fit] Computing image from signals
[Decoder.fit] Computing image from signals
[Decoder.fit] Computing image from signals
[Decoder.fit] Computing image from signals
[Decoder.fit] Computing image from signals
[Decoder.fit] Computing image from signals
[Decoder.fit] Computing image from signals
svc_l2    : 57.75s
    scissors       vs all -- AUC: 0.90 +- 0.09
    face           vs all -- AUC: 0.96 +- 0.05
    cat            vs all -- AUC: 0.96 +- 0.04
    shoe           vs all -- AUC: 0.91 +- 0.08
    house          vs all -- AUC: 1.00 +- 0.00
    scrambledpix   vs all -- AUC: 0.96 +- 0.10
    bottle         vs all -- AUC: 0.82 +- 0.17
    chair          vs all -- AUC: 0.87 +- 0.16
Visualization
# Then we make a rudimentary diagram
import matplotlib.pyplot as plt

plt.subplots(figsize=(8, 6), constrained_layout=True)

all_categories = np.sort(np.hstack([categories, "AVERAGE"]))
tick_position = np.arange(len(all_categories))
plt.yticks(tick_position + 0.25, all_categories)
height = 0.1

for color, classifier_name in zip(
    ["b", "m", "k", "r", "g"], classifiers, strict=False
):
    score_means = [
        np.mean(classifiers_data[classifier_name]["score"][category])
        for category in all_categories
    ]

    plt.barh(
        tick_position,
        score_means,
        label=classifier_name.replace("_", " "),
        height=height,
        color=color,
    )
    tick_position = tick_position + height

plt.xlabel("Classification accuracy (AUC score)")
plt.ylabel("Visual stimuli category")
plt.xlim(xmin=0.5)
plt.legend(ncol=1, bbox_to_anchor=(1.3, 0.2))
plt.title(
    "Category-specific classification accuracy for different classifiers"
)
Text(0.5, 1.0, 'Category-specific classification accuracy for different classifiers')
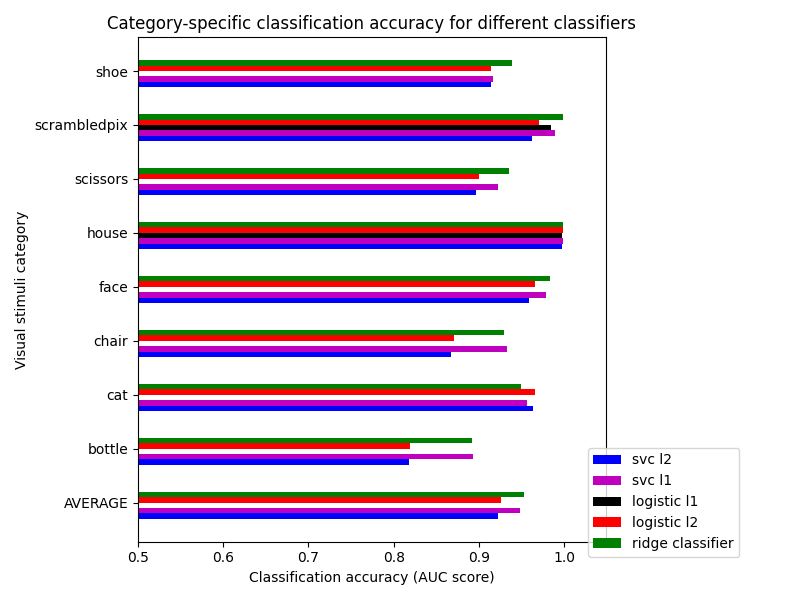
We can see that for a fixed penalty the results are similar between the svc and the logistic regression. The main difference relies on the penalty l1and l2). The sparse penalty works better because we are in an intra-subject setting.
Visualizing the face vs house map
Restrict the decoding to face vs house
condition_mask = np.logical_or(stimuli == "face", stimuli == "house")
stimuli = stimuli[condition_mask]
assert len(stimuli) == 216
fmri_niimgs_condition = index_img(func_filename, condition_mask)
run_labels = labels["chunks"][condition_mask]
categories = stimuli.unique()
assert len(categories) == 2

for classifier_name in sorted(classifiers):
    decoder = Decoder(
        estimator=classifier_name,
        mask=mask_filename,
        standardize="zscore_sample",
        cv=cv,
        screening_percentile=100,
    )
    decoder.fit(fmri_niimgs_condition, stimuli, groups=run_labels)
    classifiers_data[classifier_name] = {}
    classifiers_data[classifier_name]["score"] = decoder.cv_scores_
    classifiers_data[classifier_name]["map"] = decoder.coef_img_["face"]
/home/runner/work/nilearn/nilearn/examples/02_decoding/plot_haxby_different_estimators.py:187: UserWarning:
[NiftiMasker.fit] Generation of a mask has been requested (imgs != None) while a mask was given at masker creation. Given mask will be used.
/home/runner/work/nilearn/nilearn/.tox/doc/lib/python3.10/site-packages/sklearn/linear_model/_logistic.py:1901: UserWarning:
l1_ratios parameter is only used when penalty is 'elasticnet'. Got (penalty=l2)
/home/runner/work/nilearn/nilearn/.tox/doc/lib/python3.10/site-packages/sklearn/linear_model/_logistic.py:1901: UserWarning:
l1_ratios parameter is only used when penalty is 'elasticnet'. Got (penalty=l2)
/home/runner/work/nilearn/nilearn/.tox/doc/lib/python3.10/site-packages/sklearn/linear_model/_logistic.py:1901: UserWarning:
l1_ratios parameter is only used when penalty is 'elasticnet'. Got (penalty=l2)
/home/runner/work/nilearn/nilearn/.tox/doc/lib/python3.10/site-packages/sklearn/linear_model/_logistic.py:1901: UserWarning:
l1_ratios parameter is only used when penalty is 'elasticnet'. Got (penalty=l2)
/home/runner/work/nilearn/nilearn/.tox/doc/lib/python3.10/site-packages/sklearn/linear_model/_logistic.py:1901: UserWarning:
l1_ratios parameter is only used when penalty is 'elasticnet'. Got (penalty=l2)
/home/runner/work/nilearn/nilearn/.tox/doc/lib/python3.10/site-packages/sklearn/linear_model/_logistic.py:1901: UserWarning:
l1_ratios parameter is only used when penalty is 'elasticnet'. Got (penalty=l2)
/home/runner/work/nilearn/nilearn/.tox/doc/lib/python3.10/site-packages/sklearn/linear_model/_logistic.py:1901: UserWarning:
l1_ratios parameter is only used when penalty is 'elasticnet'. Got (penalty=l2)
/home/runner/work/nilearn/nilearn/.tox/doc/lib/python3.10/site-packages/sklearn/linear_model/_logistic.py:1901: UserWarning:
l1_ratios parameter is only used when penalty is 'elasticnet'. Got (penalty=l2)
/home/runner/work/nilearn/nilearn/.tox/doc/lib/python3.10/site-packages/sklearn/linear_model/_logistic.py:1901: UserWarning:
l1_ratios parameter is only used when penalty is 'elasticnet'. Got (penalty=l2)
/home/runner/work/nilearn/nilearn/.tox/doc/lib/python3.10/site-packages/sklearn/linear_model/_logistic.py:1901: UserWarning:
l1_ratios parameter is only used when penalty is 'elasticnet'. Got (penalty=l2)
/home/runner/work/nilearn/nilearn/.tox/doc/lib/python3.10/site-packages/sklearn/linear_model/_logistic.py:1901: UserWarning:
l1_ratios parameter is only used when penalty is 'elasticnet'. Got (penalty=l2)
/home/runner/work/nilearn/nilearn/.tox/doc/lib/python3.10/site-packages/sklearn/linear_model/_logistic.py:1901: UserWarning:
l1_ratios parameter is only used when penalty is 'elasticnet'. Got (penalty=l2)
/home/runner/work/nilearn/nilearn/examples/02_decoding/plot_haxby_different_estimators.py:187: UserWarning:
[NiftiMasker.fit] Generation of a mask has been requested (imgs != None) while a mask was given at masker creation. Given mask will be used.
/home/runner/work/nilearn/nilearn/examples/02_decoding/plot_haxby_different_estimators.py:187: UserWarning:
[NiftiMasker.fit] Generation of a mask has been requested (imgs != None) while a mask was given at masker creation. Given mask will be used.
/home/runner/work/nilearn/nilearn/examples/02_decoding/plot_haxby_different_estimators.py:187: UserWarning:
[NiftiMasker.fit] Generation of a mask has been requested (imgs != None) while a mask was given at masker creation. Given mask will be used.
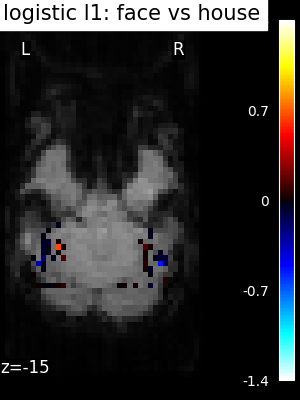
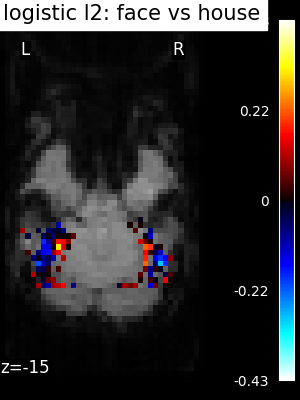
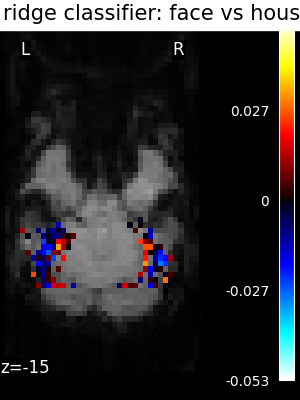
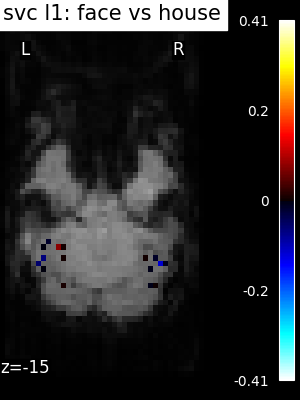
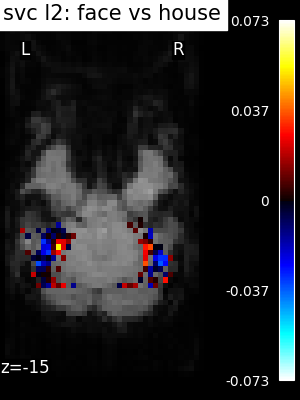
Finally, we plot the face vs house map for the different classifiers Use the average EPI as a background
from nilearn.image import mean_img

mean_epi_img = mean_img(func_filename)

for classifier_name in sorted(classifiers):
    coef_img = classifiers_data[classifier_name]["map"]
    threshold = np.max(np.abs(get_data(coef_img))) * 1e-3
    plot_stat_map(
        coef_img,
        bg_img=mean_epi_img,
        display_mode="z",
        cut_coords=[-15],
        threshold=threshold,
        title=f"{classifier_name.replace('_', ' ')}: face vs house",
        figure=plt.figure(figsize=(3, 4)),
    )

show()
/home/runner/work/nilearn/nilearn/examples/02_decoding/plot_haxby_different_estimators.py:212: UserWarning:

You are using the 'agg' matplotlib backend that is non-interactive.
No figure will be plotted when calling matplotlib.pyplot.show() or nilearn.plotting.show().
You can fix this by installing a different backend: for example via
        pip install PyQt6
Total running time of the script: (10 minutes 24.804 seconds)
Estimated memory usage: 1331 MB
