Note
Go to the end to download the full example code. or to run this example in your browser via Binder
Basic Atlas plotting
Plot the regions of reference atlases.
Check the list of atlases to know which ones are shipped with Nilearn.
Retrieving the atlas data
from nilearn import datasets

dataset_ho = datasets.fetch_atlas_harvard_oxford("cort-maxprob-thr25-2mm")
atlas_ho_filename = dataset_ho.filename
print(f"Atlas ROIs are located at: {atlas_ho_filename}")

dataset_ju = datasets.fetch_atlas_juelich("maxprob-thr0-1mm")
atlas_ju_filename = dataset_ju.filename
print(f"Atlas ROIs are located at: {atlas_ju_filename}")
[fetch_atlas_harvard_oxford] Dataset directory found:
/home/runner/work/nilearn/nilearn/nilearn_data/fsl
Atlas ROIs are located at: /home/runner/work/nilearn/nilearn/nilearn_data/fsl/data/atlases/HarvardOxford/HarvardOxford-cort-maxprob-thr25-2mm.nii.gz
[fetch_atlas_juelich] Dataset directory found:
/home/runner/work/nilearn/nilearn/nilearn_data/fsl
Atlas ROIs are located at: /home/runner/work/nilearn/nilearn/nilearn_data/fsl/data/atlases/Juelich/Juelich-maxprob-thr0-1mm.nii.gz
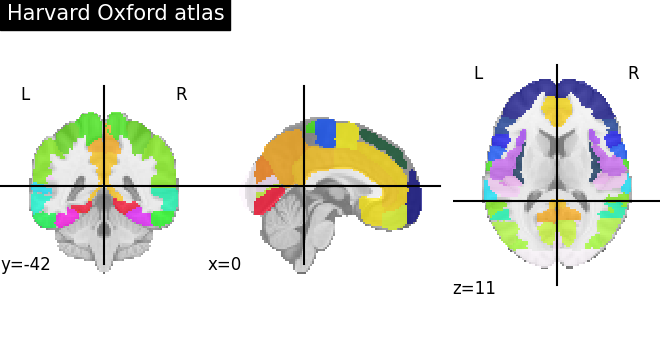
Visualizing the Harvard-Oxford atlas
from nilearn.plotting import plot_roi, show

plot_roi(atlas_ho_filename, title="Harvard Oxford atlas")
<nilearn.plotting.displays._slicers.OrthoSlicer object at 0x7eff2e4bd210>
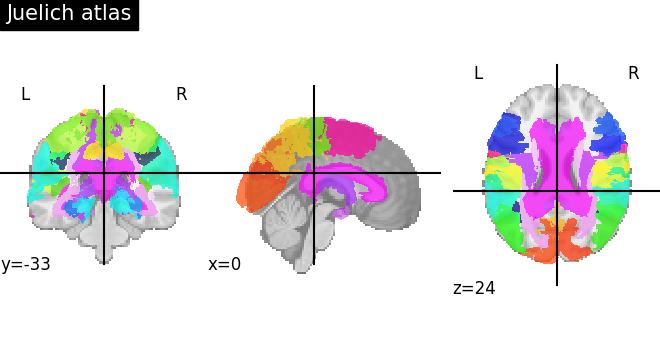
Visualizing the Juelich atlas
plot_roi(atlas_ju_filename, title="Juelich atlas")
<nilearn.plotting.displays._slicers.OrthoSlicer object at 0x7eff2ed7f040>
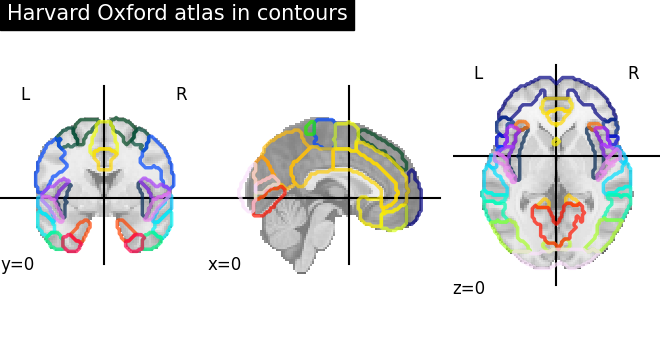
Visualizing the Harvard-Oxford atlas with contours
plot_roi(
    atlas_ho_filename,
    view_type="contours",
    title="Harvard Oxford atlas in contours",
)
show()
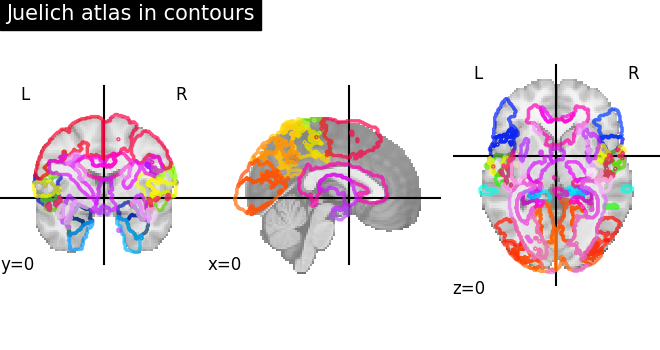
Visualizing the Juelich atlas with contours
plot_roi(
    atlas_ju_filename, view_type="contours", title="Juelich atlas in contours"
)
show()
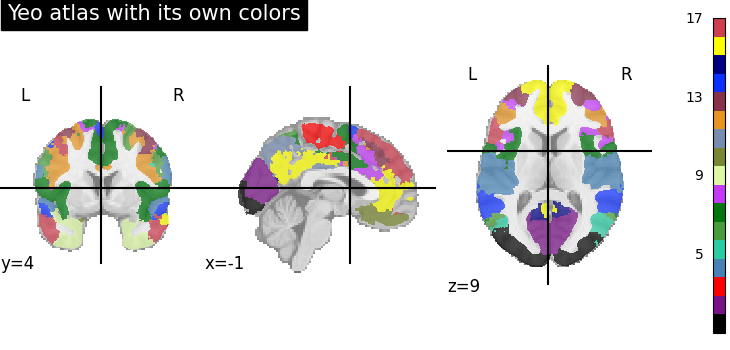
Visualizing an atlas with its own colormap
Some atlases come with a look-up table that determines the color to use to represent each of its regions.
You can pass this look-up table
as a pandas dataframe to the cmap argument
to use its colormap.
Look-up table format
The look-up table must be formatted according to the BIDS standard.
and that the colors must be in color column using hexadecimal values.
If an invalid look-up table is passed,
a warning will be thrown and the plot_roi function
will fall back to using its default colormap.
Here we are using the Yeo atlas that comes with a predefined colormap.
dataset_yeo = datasets.fetch_atlas_yeo_2011(n_networks=17)

print(dataset_yeo.lut)
[fetch_atlas_yeo_2011] Dataset directory found:
/home/runner/work/nilearn/nilearn/nilearn_data/yeo_2011
    index           name    color
0       0     Background  #000000
1       1   17Networks_1  #781286
2       2   17Networks_2  #ff0000
3       3   17Networks_3  #4682b4
4       4   17Networks_4  #2acca4
5       5   17Networks_5  #4a9b3c
6       6   17Networks_6  #00760e
7       7   17Networks_7  #c43afa
8       8   17Networks_8  #ff98d5
9       9   17Networks_9  #dcf8a4
10     10  17Networks_10  #7a8732
11     11  17Networks_11  #778cb0
12     12  17Networks_12  #e69422
13     13  17Networks_13  #87324a
14     14  17Networks_14  #0c30ff
15     15  17Networks_15  #000082
16     16  17Networks_16  #ffff00
17     17  17Networks_17  #cd3e4e
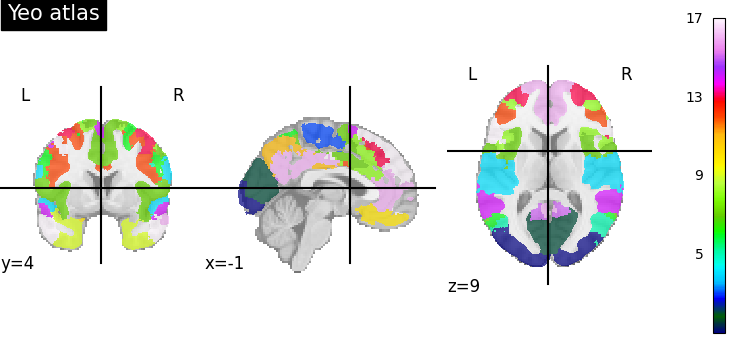
Let’s compare the atlas with the default colormap and its own colormap.
plot_roi(
    dataset_yeo.maps,
    title="Yeo atlas",
    colorbar=True,
)

plot_roi(
    dataset_yeo.maps,
    title="Yeo atlas with its own colors",
    cmap=dataset_yeo.lut,
    colorbar=True,
)

show()
Total running time of the script: (0 minutes 27.808 seconds)
Estimated memory usage: 796 MB