Note
Go to the end to download the full example code or to run this example in your browser via Binder.
Controlling the contrast of the background when plotting
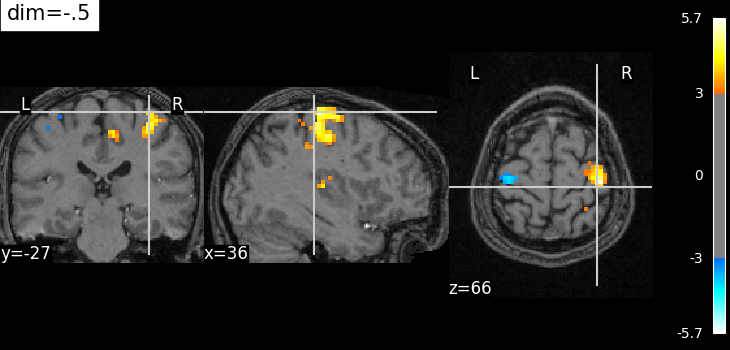
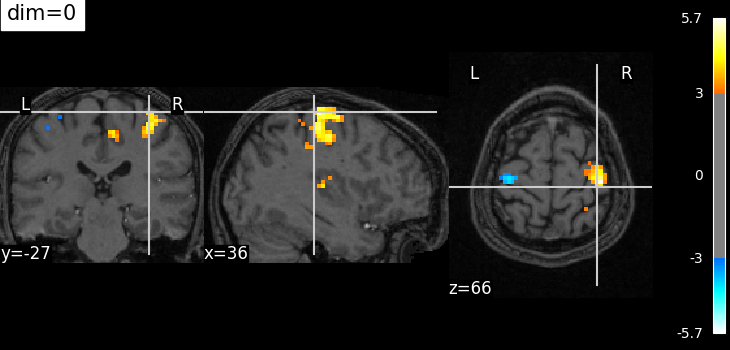
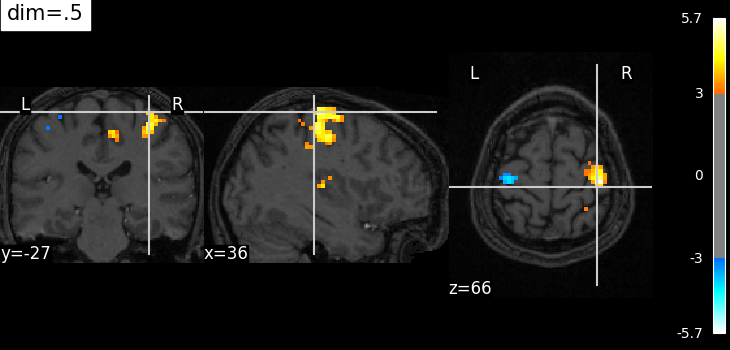
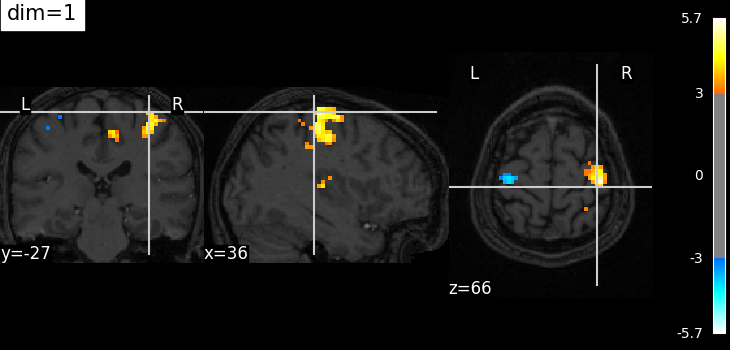
The dim argument controls the contrast of the background.
dim modifies the contrast of this image: dim=0 leaves the image unchanged, negative values of dim enhance it, and positive values decrease it (dim the background).
This dim argument may also be useful for the plot_roi function used to display ROIs on top of a background image.
Retrieve the data: the localizer dataset with contrast maps
from nilearn import datasets

localizer_dataset = datasets.fetch_localizer_button_task()
# Contrast map of motor task
localizer_tmap_filename = localizer_dataset.tmap
# Subject specific anatomical image
localizer_anat_filename = localizer_dataset.anat
[fetch_localizer_button_task] Dataset created in
/home/runner/nilearn_data/brainomics_localizer
[fetch_localizer_button_task] Downloading data from
https://osf.io/hwbm2/download ...
[fetch_localizer_button_task] Downloaded 671744 of 1508563 bytes (44.5%%,
1.2s remaining)
[fetch_localizer_button_task]  ...done. (3 seconds, 0 min)

[fetch_localizer_button_task] Downloading data from
https://osf.io/download/5d27ddc91c5b4a001b9ef9d0/ ...
[fetch_localizer_button_task]  ...done. (2 seconds, 0 min)

[fetch_localizer_button_task] Downloading data from
https://osf.io/download/5d27d29145253a001c3e284f/ ...
[fetch_localizer_button_task]  ...done. (2 seconds, 0 min)

[fetch_localizer_button_task] Downloading data from
https://osf.io/download/5d275ede1c5b4a001aa00c26/ ...
[fetch_localizer_button_task] Downloaded 671744 of 13951266 bytes (4.8%%,
19.8s remaining)
[fetch_localizer_button_task]  ...done. (3 seconds, 0 min)

[fetch_localizer_button_task] Downloading data from
https://osf.io/download/5d27037f45253a001c3d4563/ ...
[fetch_localizer_button_task]  ...done. (1 seconds, 0 min)

[fetch_localizer_button_task] Downloading data from
https://osf.io/download/5d7b8948fcbf44001c44e695/ ...
[fetch_localizer_button_task]  ...done. (1 seconds, 0 min)
Plotting with enhancement of background image with dim=-.5
from nilearn.plotting import plot_stat_map, show

cut_coords = (36, -27, 66)

plot_stat_map(
    localizer_tmap_filename,
    bg_img=localizer_anat_filename,
    cut_coords=cut_coords,
    threshold=3,
    title="dim=-.5",
    dim=-0.5,
)

<nilearn.plotting.displays._slicers.OrthoSlicer object at 0x7fd159475690>
Plotting with no change of contrast in background image with dim=0
plot_stat_map(
    localizer_tmap_filename,
    bg_img=localizer_anat_filename,
    cut_coords=cut_coords,
    threshold=3,
    title="dim=0",
    dim=0,
)

<nilearn.plotting.displays._slicers.OrthoSlicer object at 0x7fd134e44a90>
Plotting with decrease of contrast in background image with dim=.5
plot_stat_map(
    localizer_tmap_filename,
    bg_img=localizer_anat_filename,
    cut_coords=cut_coords,
    threshold=3,
    title="dim=.5",
    dim=0.5,
)

<nilearn.plotting.displays._slicers.OrthoSlicer object at 0x7fd13539ca30>
Plotting with more decrease in contrast with dim=1
plot_stat_map(
    localizer_tmap_filename,
    bg_img=localizer_anat_filename,
    cut_coords=cut_coords,
    threshold=3,
    title="dim=1",
    dim=1,
)

show()

/home/runner/work/nilearn/nilearn/examples/01_plotting/plot_dim_plotting.py:81: UserWarning:

You are using the 'agg' matplotlib backend that is non-interactive.
No figure will be plotted when calling matplotlib.pyplot.show() or nilearn.plotting.show().
You can fix this by installing a different backend: for example via
        pip install PyQt6
Total running time of the script: (0 minutes 17.756 seconds)
Estimated memory usage: 108 MB