Note
This page is a reference documentation. It only explains the function signature, and not how to use it. Please refer to the user guide for the big picture.
nilearn.plotting.show
- nilearn.plotting.show()[source]
Show all the figures generated by nilearn and/or matplotlib.
This function is equivalent to
matplotlib.pyplot.show, but is skipped on the ‘Agg’ backend where it has no effect other than to emit a warning.
Examples using nilearn.plotting.show
Basic nilearn example: manipulating and looking at data
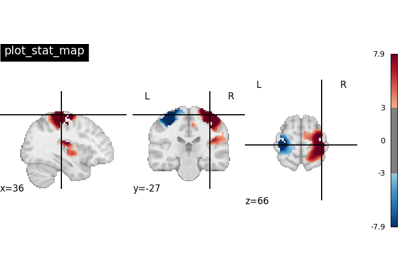
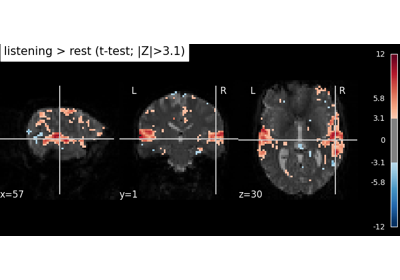
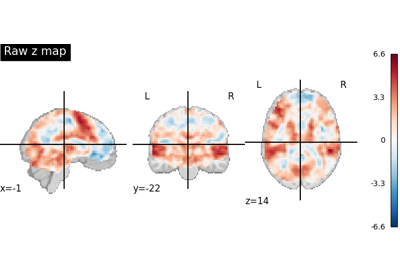
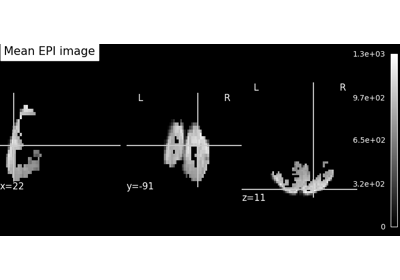
Intro to GLM Analysis: a single-run, single-subject fMRI dataset
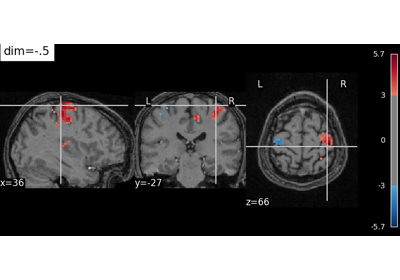
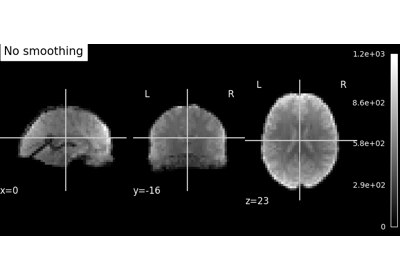
Controlling the contrast of the background when plotting

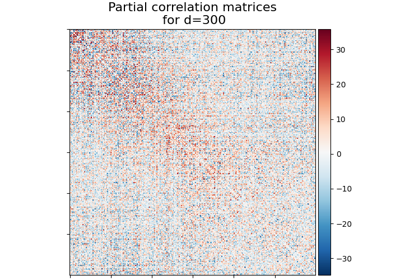
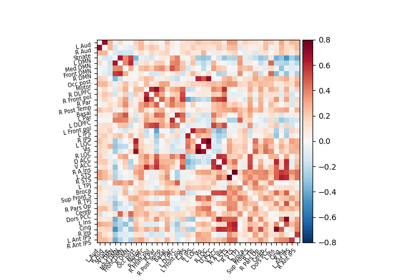
Visualizing Megatrawls Network Matrices from Human Connectome Project
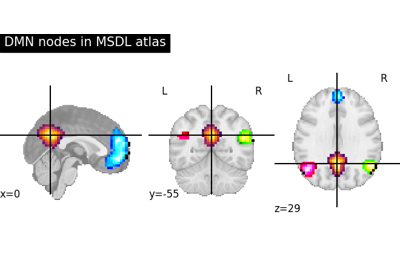
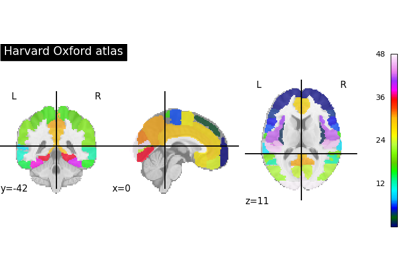
Visualizing a probabilistic atlas: the default mode in the MSDL atlas
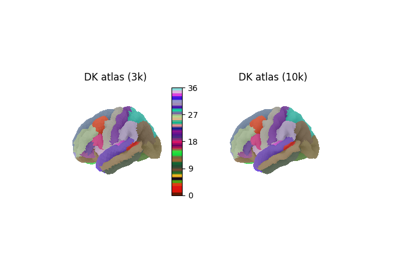
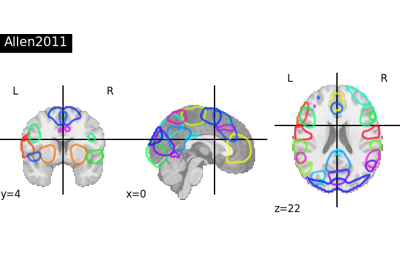
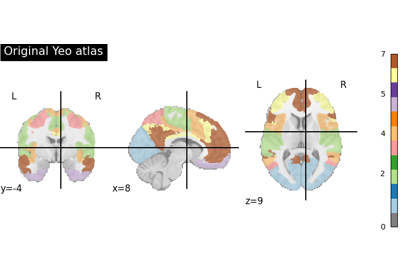
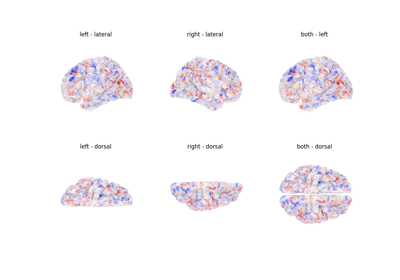
Visualizing multiscale functional brain parcellations
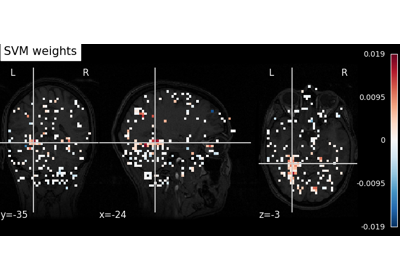
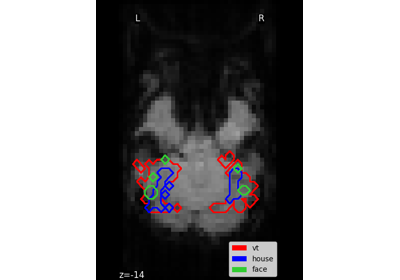
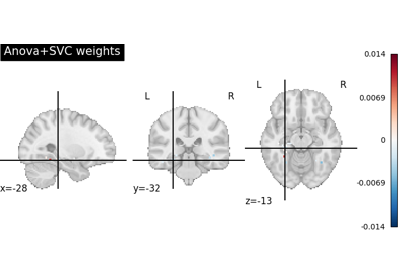
Decoding with ANOVA + SVM: face vs house in the Haxby dataset
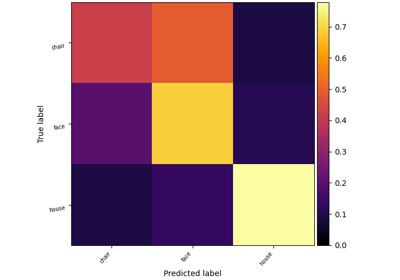
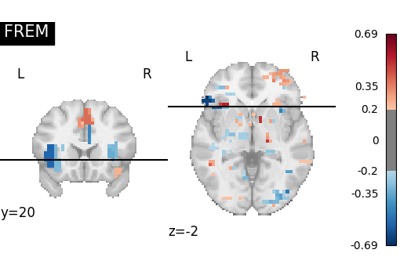
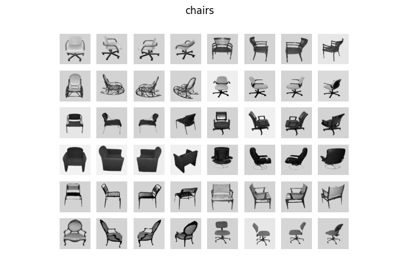
Decoding with FREM: face vs house vs chair object recognition
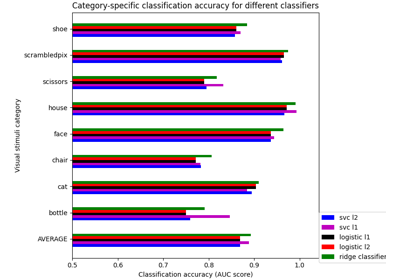
Different classifiers in decoding the Haxby dataset
Encoding models for visual stimuli from Miyawaki et al. 2008
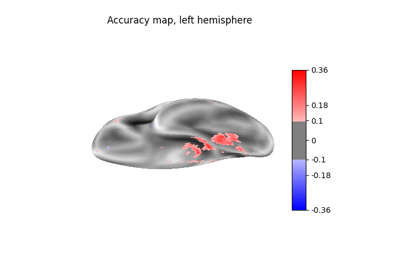
ROI-based decoding analysis in Haxby et al. dataset
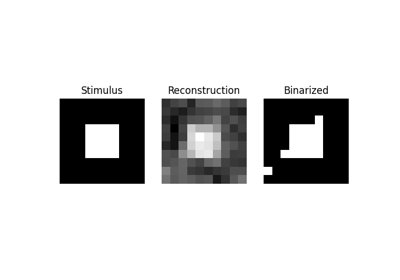
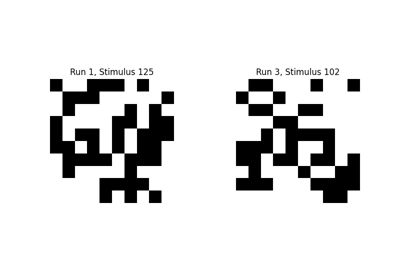
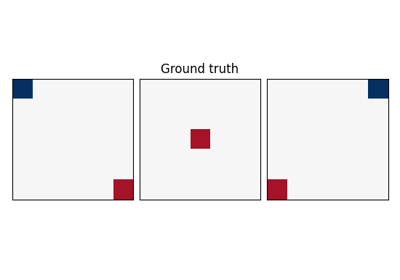
Reconstruction of visual stimuli from Miyawaki et al. 2008
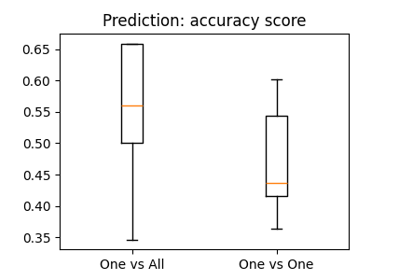
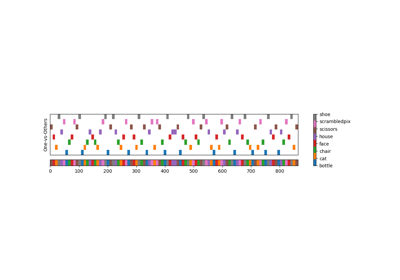
The haxby dataset: different multi-class strategies
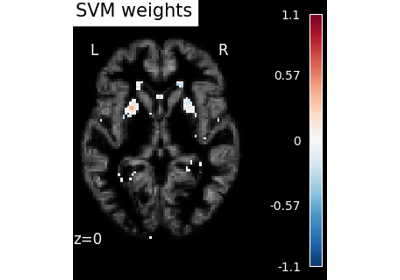
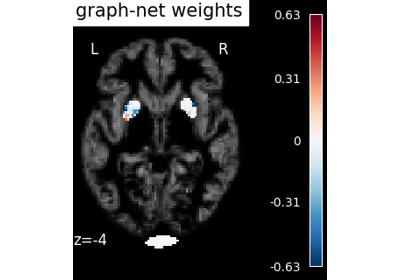
Voxel-Based Morphometry on Oasis dataset with Space-Net prior
Classification of age groups using functional connectivity
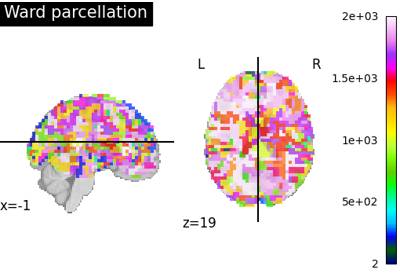
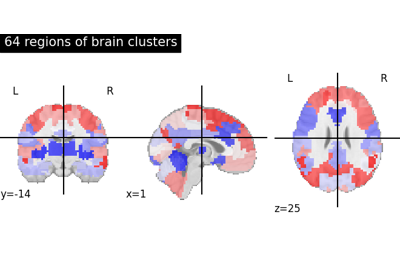
Clustering methods to learn a brain parcellation from fMRI
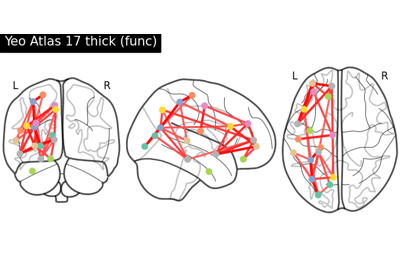
Comparing connectomes on different reference atlases
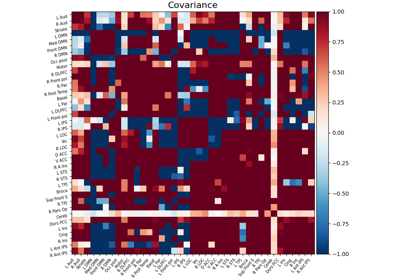
Computing a connectome with sparse inverse covariance
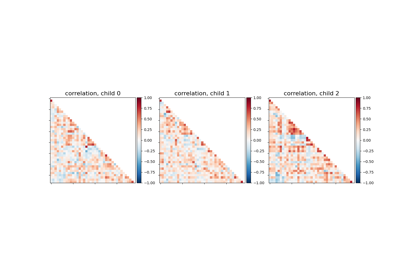
Connectivity structure estimation on simulated data
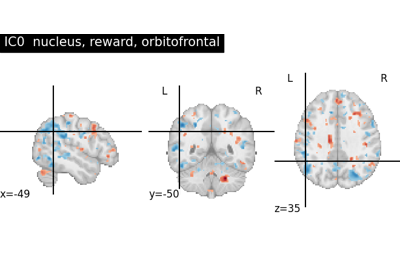
Deriving spatial maps from group fMRI data using ICA and Dictionary Learning
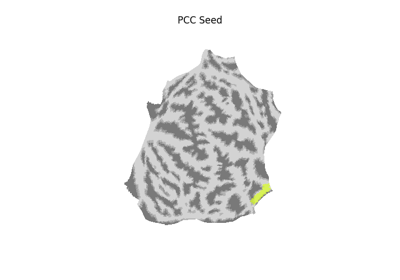
Extracting signals of a probabilistic atlas of functional regions
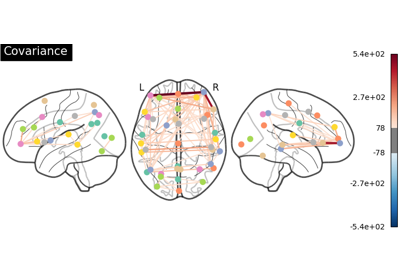
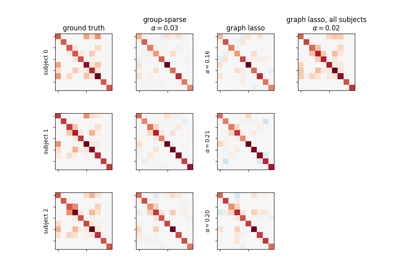
Group Sparse inverse covariance for multi-subject connectome
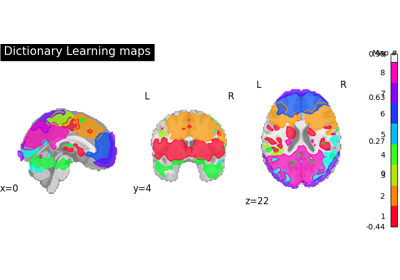
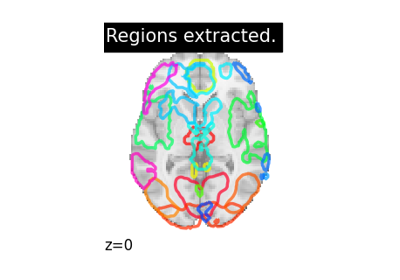
Regions extraction using dictionary learning and functional connectomes
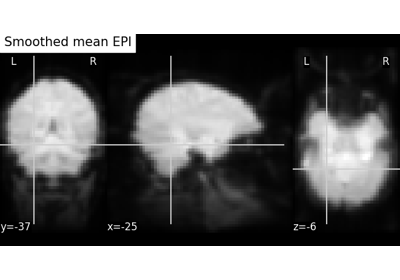
First level analysis of a complete BIDS dataset from openneuro
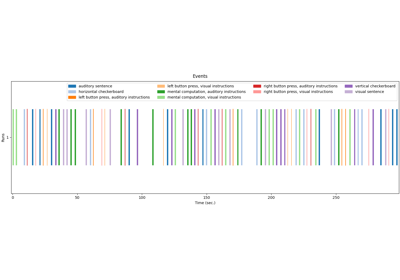
Generate an events.tsv file for the NeuroSpin localizer task
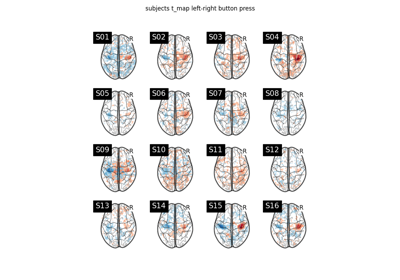
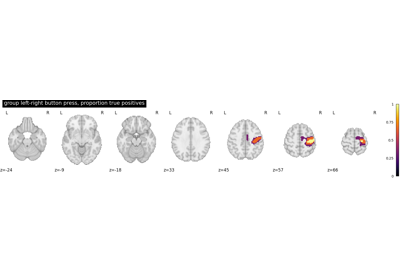
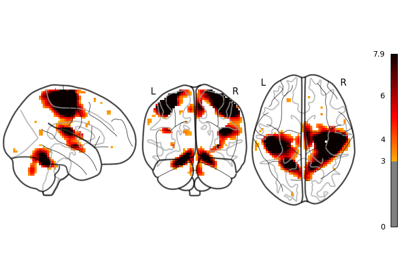
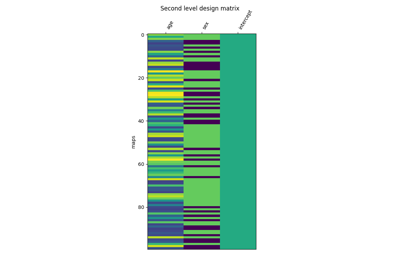
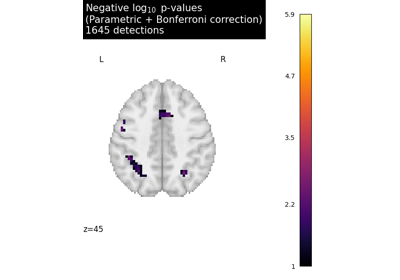
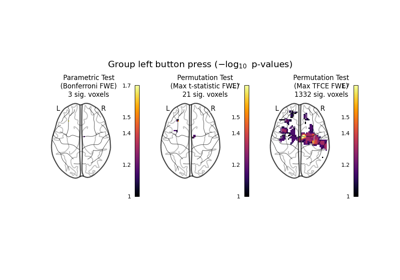
Second-level fMRI model: true positive proportion in clusters
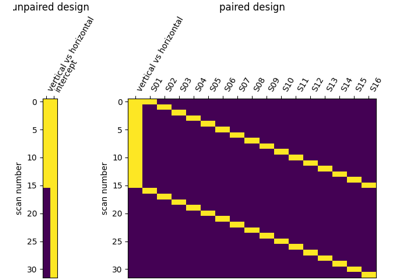
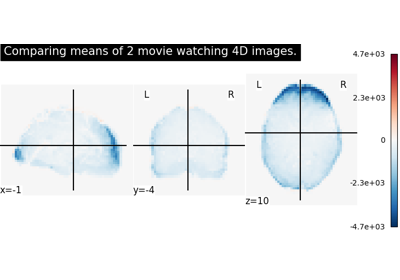
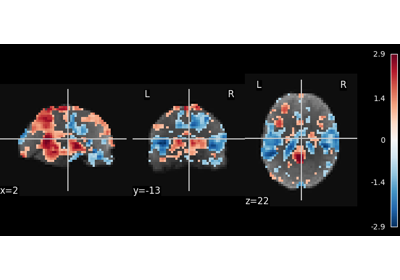
Second-level fMRI model: two-sample test, unpaired and paired
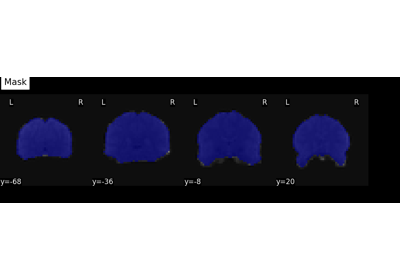
Computing a Region of Interest (ROI) mask manually
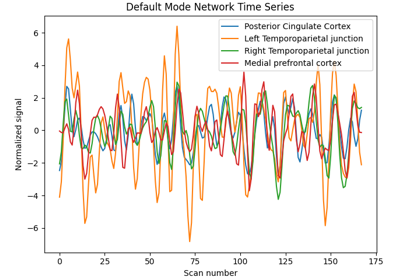
Regions Extraction of Default Mode Networks using Smith Atlas
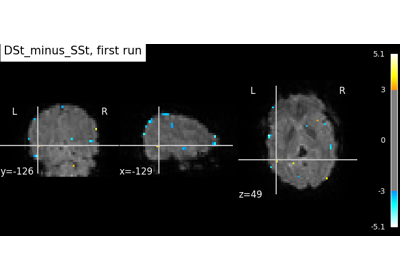
Beta-Series Modeling for Task-Based Functional Connectivity and Decoding
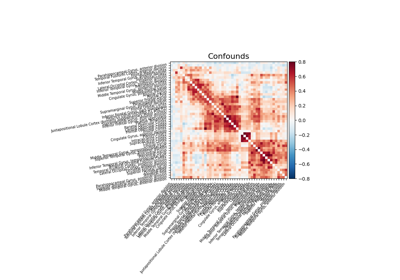
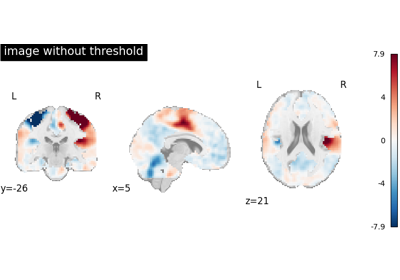
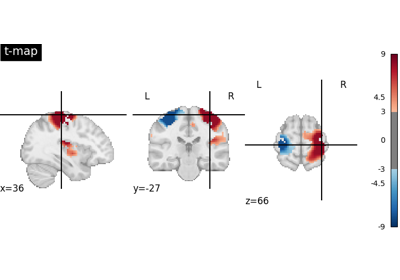
Massively univariate analysis of a calculation task from the Localizer dataset
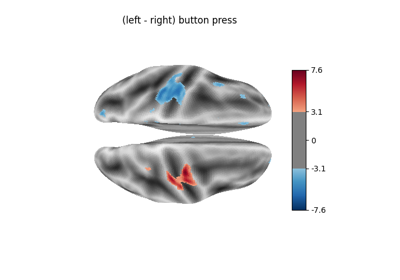
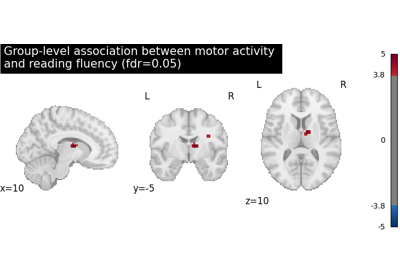
Massively univariate analysis of a motor task from the Localizer dataset
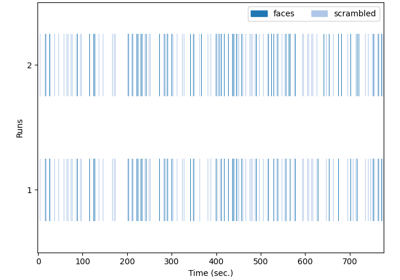
Massively univariate analysis of face vs house recognition
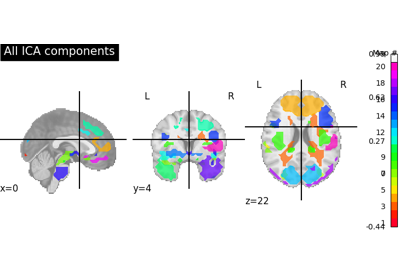
Multivariate decompositions: Independent component analysis of fMRI
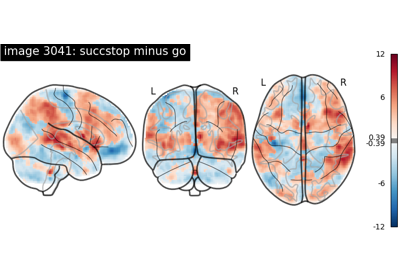
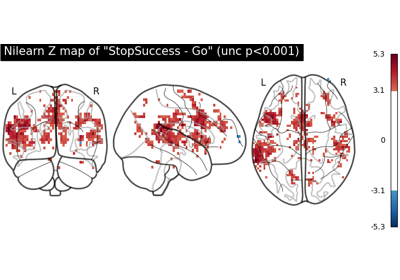
NeuroVault meta-analysis of stop-go paradigm studies
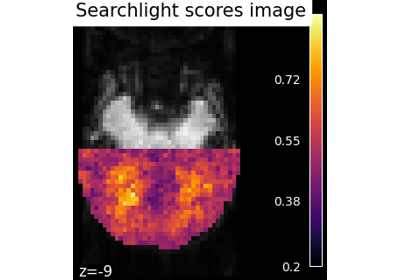
SearchLight MVPA with a custom correlation estimator on Haxby data