Note
Go to the end to download the full example code or to run this example in your browser via Binder.
Extracting signals from brain regions using the NiftiLabelsMasker
This simple example shows how to extract signals from functional
fMRI data and brain regions defined through an atlas.
More precisely, this example shows how to use the
NiftiLabelsMasker object to perform this
operation in just a few lines of code.
Warning
If you are using Nilearn with a version older than 0.9.0,
then you should either upgrade your version or import maskers
from the input_data module instead of the maskers module.
That is, you should manually replace in the following example all occurrences of:
from nilearn.maskers import NiftiMasker
with:
from nilearn.input_data import NiftiMasker
from nilearn._utils.helpers import check_matplotlib

check_matplotlib()
Retrieve the brain development functional dataset
We start by fetching the brain development functional dataset and we restrict the example to one subject only.
from nilearn.datasets import fetch_atlas_harvard_oxford, fetch_development_fmri

dataset = fetch_development_fmri(n_subjects=1)
func_filename = dataset.func[0]

# print basic information on the dataset
print(f"First functional nifti image (4D) is at: {func_filename}")
[fetch_development_fmri] Dataset found in
/home/runner/nilearn_data/development_fmri
[fetch_development_fmri] Dataset found in
/home/runner/nilearn_data/development_fmri/development_fmri
[fetch_development_fmri] Dataset found in
/home/runner/nilearn_data/development_fmri/development_fmri
First functional nifti image (4D) is at: /home/runner/nilearn_data/development_fmri/development_fmri/sub-pixar123_task-pixar_space-MNI152NLin2009cAsym_desc-preproc_bold.nii.gz
Load an atlas
We then load the Harvard-Oxford atlas to define the brain regions and the first label correspond to the background.
atlas = fetch_atlas_harvard_oxford("cort-maxprob-thr25-2mm")
print(f"The atlas contains {len(atlas.labels) - 1} non-overlapping regions")
[fetch_atlas_harvard_oxford] Dataset found in /home/runner/nilearn_data/fsl
The atlas contains 48 non-overlapping regions
Instantiate the mask and visualize atlas
Instantiate the masker with label image and label values
from nilearn.maskers import NiftiLabelsMasker

masker = NiftiLabelsMasker(
    atlas.maps, lut=atlas.lut, standardize="zscore_sample", verbose=1
)
Visualize the atlas
We need to call fit prior to generating the mask. We can then generate a report to visualize the atlas.
Note
The generated report can be:
displayed in a Notebook,
opened in a browser using the
.open_in_browser()method,or saved to a file using the
.save_as_html(output_filepath)method.
[NiftiLabelsMasker.fit] Loading regions from <nibabel.nifti1.Nifti1Image object
at 0x7f0fccd9f5b0>
[NiftiLabelsMasker.fit] Finished fit
/home/runner/work/nilearn/nilearn/examples/06_manipulating_images/plot_nifti_labels_simple.py:68: UserWarning: No image provided to fit in NiftiLabelsMasker. Plotting ROIs of label image on the MNI152Template for reporting.
  report = masker.generate_report()
Fitting the masker on data and generating a report
We can again generate a report, but this time, the provided functional image is displayed with the ROI of the atlas. The report also contains a summary table giving the region sizes in mm3.
[NiftiLabelsMasker.fit] Loading regions from <nibabel.nifti1.Nifti1Image object
at 0x7f0fccd9f5b0>
[NiftiLabelsMasker.fit] Resampling regions
[NiftiLabelsMasker.fit] Finished fit
Process the data with the NiftiLablesMasker
In order to extract the signals, we need to call transform on the functional data.
signals = masker.transform(func_filename)

# signals is a 2D numpy array, (n_time_points x n_regions)
print(f"{signals.shape=}")
[NiftiLabelsMasker.wrapped] Loading data from
'/home/runner/nilearn_data/development_fmri/development_fmri/sub-pixar123_task-p
ixar_space-MNI152NLin2009cAsym_desc-preproc_bold.nii.gz'
[NiftiLabelsMasker.wrapped] Extracting region signals
[NiftiLabelsMasker.wrapped] Cleaning extracted signals
signals.shape=(168, 48)
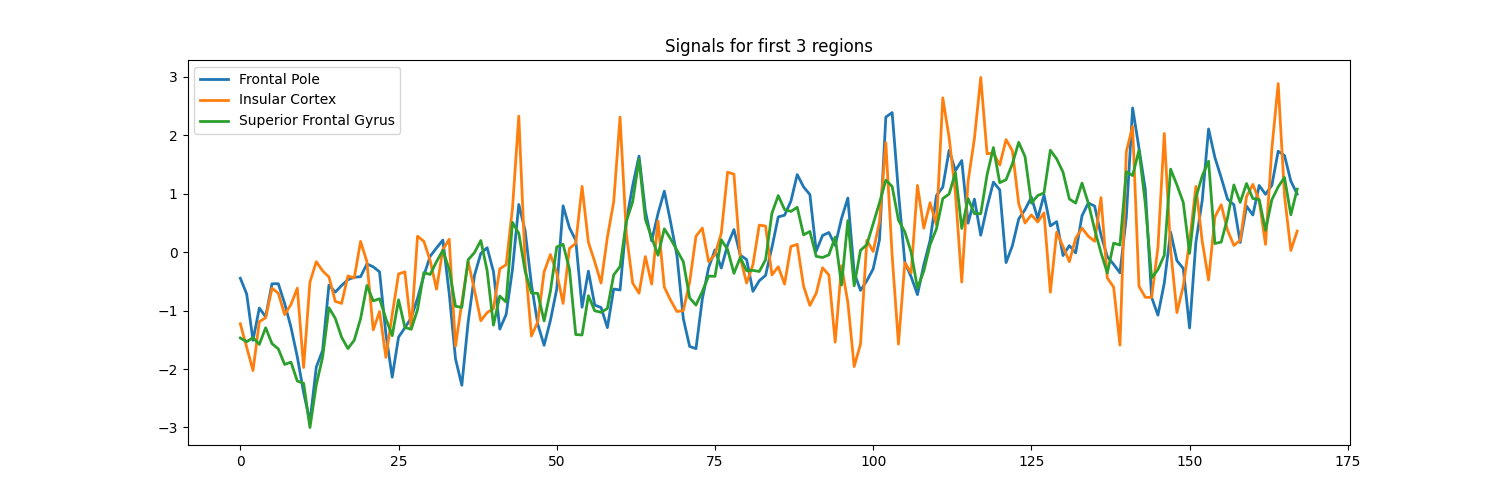
Output to dataframe and plot
You can use ‘set_output()’ to decide the output format of ‘transform’. If you want to output to a DataFrame, you an choose pandas and polars.
masker.set_output(transform="pandas")
signals_df = masker.transform(func_filename)
print(signals_df.head)

signals_df[["Frontal Pole", "Insular Cortex", "Superior Frontal Gyrus"]].plot(
    title="Signals from 3 regions", figsize=(15, 5)
)

[NiftiLabelsMasker.wrapped] Loading data from
'/home/runner/nilearn_data/development_fmri/development_fmri/sub-pixar123_task-p
ixar_space-MNI152NLin2009cAsym_desc-preproc_bold.nii.gz'
[NiftiLabelsMasker.wrapped] Extracting region signals
[NiftiLabelsMasker.wrapped] Cleaning extracted signals
<bound method NDFrame.head of      Frontal Pole  Insular Cortex  ...  Supracalcarine Cortex  Occipital Pole
0       -0.446359       -1.225659  ...              -3.582685       -2.001927
1       -0.715557       -1.626162  ...              -2.323499       -2.348940
2       -1.508380       -2.026665  ...              -1.190231       -2.087385
3       -0.956851       -1.190833  ...              -0.371760       -2.600137
4       -1.106224       -1.121180  ...              -0.686556       -2.732209
..            ...             ...  ...                    ...             ...
163      1.142570        1.769406  ...               0.950386        0.844104
164      1.726928        2.883849  ...               1.705898        0.191511
165      1.653063        0.968400  ...               2.839166        0.346890
166      1.216436        0.028089  ...               2.335491       -0.189168
167      0.993198        0.358939  ...               0.635589       -0.310882

[168 rows x 48 columns]>

<Axes: title={'center': 'Signals from 3 regions'}>
Total running time of the script: (0 minutes 9.963 seconds)
Estimated memory usage: 558 MB