Note
Go to the end to download the full example code. or to run this example in your browser via Binder
Massively univariate analysis of a visual task from the Haxby dataset
To determine whether or not a voxel responds differently under different
conditions of a visual task, we use a permuted
Ordinary Least Squares
(OLS)
analysis,
run at each voxel with permuted_ols.
As in many other examples, we compare two visual categories from the
Haxby dataset (Haxby et al.[1]): “face” and “house” images.
Note that we consider the mean image per condition separately for each run; otherwise, the observations cannot be exchanged at random because a time dependence exists between observations within the same run (see Winkler et al.[2] for more detailed explanations).
The example shows the small differences that exist between
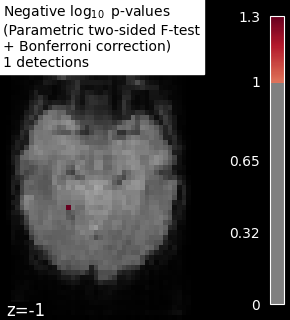
Bonferroni-corrected (FPR correction) p-values computed using an
F-test in scikit-learn with
f_regression and
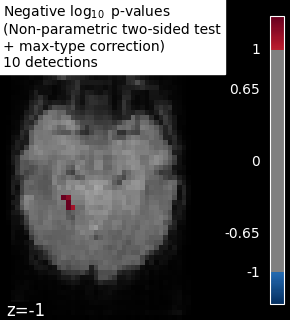
family-wise corrected (FWER correction) p-values obtained with
with permuted_ols ; i.e.,
from the permutation test combined with a max-type procedure,
following the approach of Anderson and Robinson[3].
We find that Bonferroni correction is a bit more conservative, as revealed by the higher detection rate.
Load one subject from the Haxby dataset
from nilearn import datasets, image
from nilearn.plotting import plot_stat_map, show

haxby_dataset = datasets.fetch_haxby(n_subjects=[2])

# print basic information on the dataset
print(f"Mask nifti image (3D) is located at: {haxby_dataset.mask}")
print(f"Functional nifti image (4D) is located at: {haxby_dataset.func[0]}")
[wrapper] Dataset directory found: /home/runner/work/nilearn/nilearn/nilearn_data/haxby2001
Mask nifti image (3D) is located at: /home/runner/work/nilearn/nilearn/nilearn_data/haxby2001/mask.nii.gz
Functional nifti image (4D) is located at: /home/runner/work/nilearn/nilearn/nilearn_data/haxby2001/subj2/bold.nii.gz
Restrict to “face” and “house” conditions
Next, we map all visual categories to numerical labels
using LabelEncoder.
This is necessary since both
permuted_ols and
f_regression
require that string labels are
encoded as integers.
Then, we subset to only include “face” and “house” task categories.
import numpy as np
import pandas as pd
from sklearn.preprocessing import LabelEncoder

df = pd.read_csv(haxby_dataset.session_target[0], sep=" ")
df = df.rename(columns={"chunks": "runs"})

le = LabelEncoder().fit(df["labels"])
categories = le.classes_
conditions_encoded = le.transform(df["labels"])

# Find and subset to timepoints where either "face"
# or "house" images are shown.
conditions_of_interest = ["face", "house"]
condition_mask = df["labels"].isin(conditions_of_interest)
conditions_encoded = conditions_encoded[condition_mask]
masked_df = df[condition_mask].reset_index()
Mask data and average per run and per condition
We consider the mean image per condition separately for each run. Otherwise, the observations cannot be exchanged at random because a time dependence exists between observations within the same run.
from nilearn.image import index_img
from nilearn.maskers import NiftiMasker

mask_filename = haxby_dataset.mask

nifti_masker = NiftiMasker(
    smoothing_fwhm=8,
    mask_img=mask_filename,
    memory="nilearn_cache",  # cache options
    memory_level=1,
    verbose=1,
)
# Take only the :term:`fMRI` volumes in the ``condition_mask``,
# and extract their voxelwise-values using ``NiftiMasker``.
func_filename = haxby_dataset.func[0]
func_reduced = index_img(func_filename, condition_mask)
fmri_masked = nifti_masker.fit_transform(func_reduced)

n_runs = masked_df["runs"].unique().size
conditions_per_run = len(conditions_of_interest)

grouped_fmri_masked = []
grouped_conditions_encoded = []

for s in range(n_runs):
    # Find images within this run
    run_subset = masked_df.loc[masked_df["runs"] == s]

    for condition in conditions_of_interest:
        # Identify indices for each condition of interest
        # and take the average of the associated fMRI volumes.
        indices = run_subset.loc[run_subset["labels"] == condition].index
        grouped_fmri_masked.append(fmri_masked[indices].mean(axis=0))
        grouped_conditions_encoded.append(le.transform([condition]))

grouped_fmri_masked = np.asarray(grouped_fmri_masked)
grouped_conditions_encoded = np.asarray(grouped_conditions_encoded)
[NiftiMasker.wrapped] Loading data from <nibabel.nifti1.Nifti1Image object at 0x7fcf77195c90>
[NiftiMasker.wrapped] Loading mask from .../mask.nii.gz
[NiftiMasker.wrapped] Resampling mask
[NiftiMasker.wrapped] Finished fit
________________________________________________________________________________
[Memory] Calling nilearn.maskers.nifti_masker.filter_and_mask...
filter_and_mask(<nibabel.nifti1.Nifti1Image object at 0x7fcf77195c90>, <nibabel.nifti1.Nifti1Image object at 0x7fcf49f0a7d0>, { 'clean_args': None,
  'clean_kwargs': {},
  'cmap': 'gray',
  'detrend': False,
  'dtype': None,
  'high_pass': None,
  'high_variance_confounds': False,
  'low_pass': None,
  'reports': True,
  'runs': None,
  'smoothing_fwhm': 8,
  'standardize': None,
  'standardize_confounds': True,
  't_r': None,
  'target_affine': None,
  'target_shape': None}, memory_level=1, memory=Memory(location=nilearn_cache/joblib), verbose=1, confounds=None, sample_mask=None, copy=True, sklearn_output_config=None)
[NiftiMasker.wrapped] Loading data from <nibabel.nifti1.Nifti1Image object at 0x7fcf77195c90>
[NiftiMasker.wrapped] Smoothing images
[NiftiMasker.wrapped] Extracting region signals
[NiftiMasker.wrapped] Cleaning extracted signals
__________________________________________________filter_and_mask - 1.3s, 0.0min
Perform massively univariate analysis with permuted OLS
We use a two-sided t-test to compute p-values, but we keep the trace of the effect sign to add it back at the end and thus observe the signed effect
from nilearn.mass_univariate import permuted_ols

# Note that an intercept as a covariate is used by default
output = permuted_ols(
    grouped_conditions_encoded,
    grouped_fmri_masked,
    n_perm=10000,
    two_sided_test=True,
    verbose=1,  # display progress bar
    random_state=0,  # to ensure reproducible results
    n_jobs=2,  # can be changed to use more CPUs
)
neg_log_pvals = output["logp_max_t"]
t_scores_original_data = output["t"]
signed_neg_log_pvals = neg_log_pvals * np.sign(t_scores_original_data)
signed_neg_log_pvals_unmasked = nifti_masker.inverse_transform(
    signed_neg_log_pvals
)
[Parallel(n_jobs=2)]: Using backend LokyBackend with 2 concurrent workers.
[Parallel(n_jobs=2)]: Done   2 out of   2 | elapsed:    9.1s finished
[NiftiMasker.inverse_transform] Computing image from signals
________________________________________________________________________________
[Memory] Calling nilearn.masking.unmask...
unmask(array([[0., ..., 0.]]), <nibabel.nifti1.Nifti1Image object at 0x7fcf49f0a7d0>)
___________________________________________________________unmask - 0.0s, 0.0min
Calculate scikit-learn F-scores, for comparison
The F-test quantifies the strength of linear dependencies between the beta maps and the occurrence of stimuli, at the voxel level. Assuming that no such effect exists, it follows a Fisher distribution, which yields p-values that can be used to assert significance. Note however that the F-test considers voxels in isolation and thus misses effects distributed across voxels. Also note that the F-test does not allow us to observe the effect sign (pure two-sided test).
from sklearn.feature_selection import f_regression

# f_regression implicitly adds intercept
_, pvals_bonferroni = f_regression(
    grouped_fmri_masked,
    grouped_conditions_encoded.ravel(),
)

# calculate the negative log of the p-values
# for equivalent visualization with
# :func:`~nilearn.mass_univariate.permuted_ols`
pvals_bonferroni *= fmri_masked.shape[1]
pvals_bonferroni[np.isnan(pvals_bonferroni)] = 1
pvals_bonferroni[pvals_bonferroni > 1] = 1
neg_log_pvals_bonferroni = -np.log10(pvals_bonferroni)

neg_log_pvals_bonferroni_unmasked = nifti_masker.inverse_transform(
    neg_log_pvals_bonferroni
)
[NiftiMasker.inverse_transform] Computing image from signals
________________________________________________________________________________
[Memory] Calling nilearn.masking.unmask...
unmask(array([-0., ..., -0.]), <nibabel.nifti1.Nifti1Image object at 0x7fcf49f0a7d0>)
___________________________________________________________unmask - 0.0s, 0.0min
Visualize the results
Since we are plotting negative log p-values and using a threshold equal to 1, it corresponds to corrected p-values lower than 10%, meaning that there is less than 10% probability to make a single false discovery (i.e., a 90% chance that we make no false discovery at all).
from nilearn.image import get_data

# Use the fMRI mean image as a surrogate of anatomical data
mean_fmri_img = image.mean_img(func_filename)

threshold = 1  # 10% corrected

vmax = min(signed_neg_log_pvals.max(), neg_log_pvals_bonferroni.max())

# Plot thresholded p-values map corresponding to F-scores
neg_log_pvals_bonferroni_data = get_data(neg_log_pvals_bonferroni_unmasked)
n_detections = (neg_log_pvals_bonferroni_data > threshold).sum()
title = (
    "Negative $\\log_{10}$ p-values"
    "\n(Parametric two-sided F-test"
    "\n+ Bonferroni correction)"
    f"\n{n_detections} detections"
)

display = plot_stat_map(
    neg_log_pvals_bonferroni_unmasked,
    mean_fmri_img,
    threshold=threshold,
    display_mode="z",
    cut_coords=[-1],
    vmax=vmax,
    vmin=threshold,
    cmap="inferno",
)

display.title(title, size=10)

# Plot permutation p-values map
n_detections = (np.abs(signed_neg_log_pvals) > threshold).sum()
title = (
    "Negative $\\log_{10}$ p-values"
    "\n(Non-parametric two-sided test"
    "\n+ max-type correction)"
    f"\n{n_detections} detections"
)

display = plot_stat_map(
    signed_neg_log_pvals_unmasked,
    mean_fmri_img,
    threshold=threshold,
    display_mode="z",
    cut_coords=[-1],
    vmax=vmax,
    vmin=threshold,
    cmap="inferno",
)

display.title(title, size=10)

show()
References
Total running time of the script: (0 minutes 20.915 seconds)
Estimated memory usage: 1285 MB
