Note
Go to the end to download the full example code. or to run this example in your browser via Binder
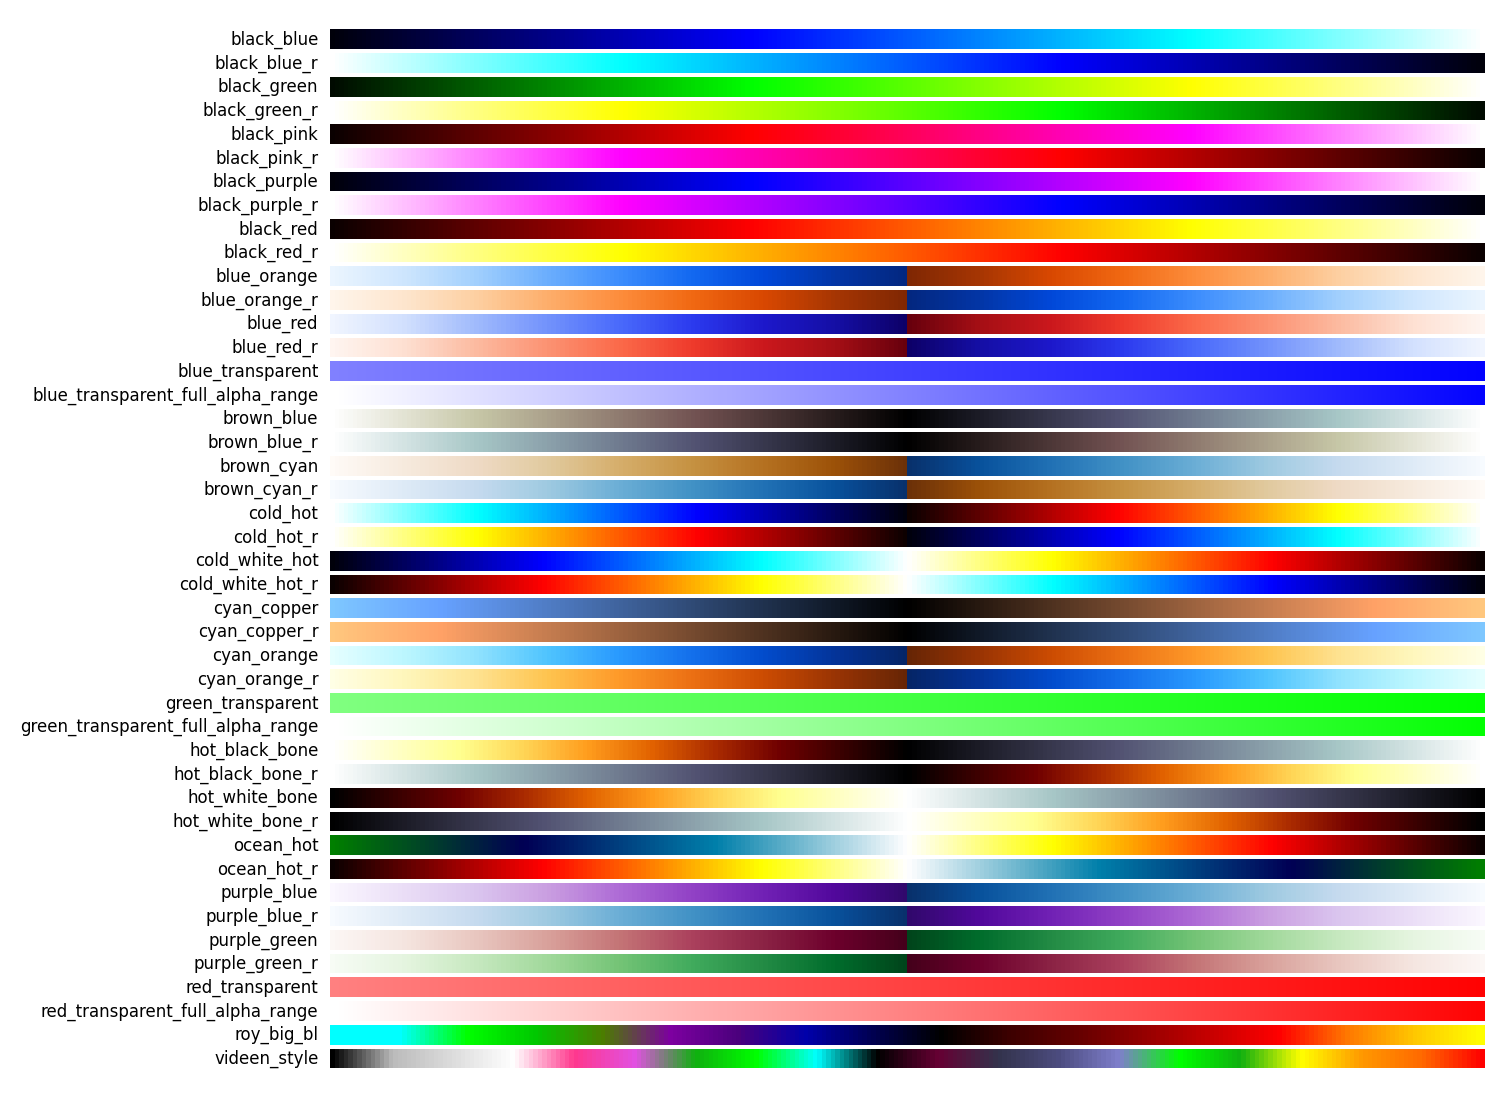
Colormaps in Nilearn
Here we show some of the colormaps that ship with Nilearn (some adapted from the HCP connectome workbench color maps).
This example show also some of the pros and cons of some of those maps.
import matplotlib.pyplot as plt
import numpy as np

from nilearn.plotting import show
from nilearn.plotting.cm import _cmap_d as nilearn_cmaps
Let’s create a function to help us plot all the colormaps with their names.
def plot_color_gradients(color_maps):
    """Create figure and adjust figure height to number of colormaps.

    Adapted from the matplolib documentation.
    """
    gradient = np.linspace(0, 1, 256)
    gradient = np.vstack((gradient, gradient))

    color_map_names = sorted(color_maps)

    nrows = len(color_map_names)
    figh = 0.3 + 0.2 + (nrows + (nrows - 1) * 0.1) * 0.22
    fig, axs = plt.subplots(nrows=nrows + 1, figsize=(15, figh))
    fig.subplots_adjust(
        top=1 - 0.3 / figh, bottom=0.2 / figh, left=0.22, right=0.99
    )

    for ax, name in zip(axs, color_map_names, strict=False):
        ax.imshow(gradient, aspect="auto", cmap=name)
        ax.text(
            -0.01,
            0.5,
            name,
            va="center",
            ha="right",
            fontsize=12,
            transform=ax.transAxes,
        )

    # Turn off *all* ticks & spines, not just the ones with colormaps.
    for ax in axs:
        ax.set_axis_off()
Plot matplotlib color maps
plot_color_gradients(nilearn_cmaps)
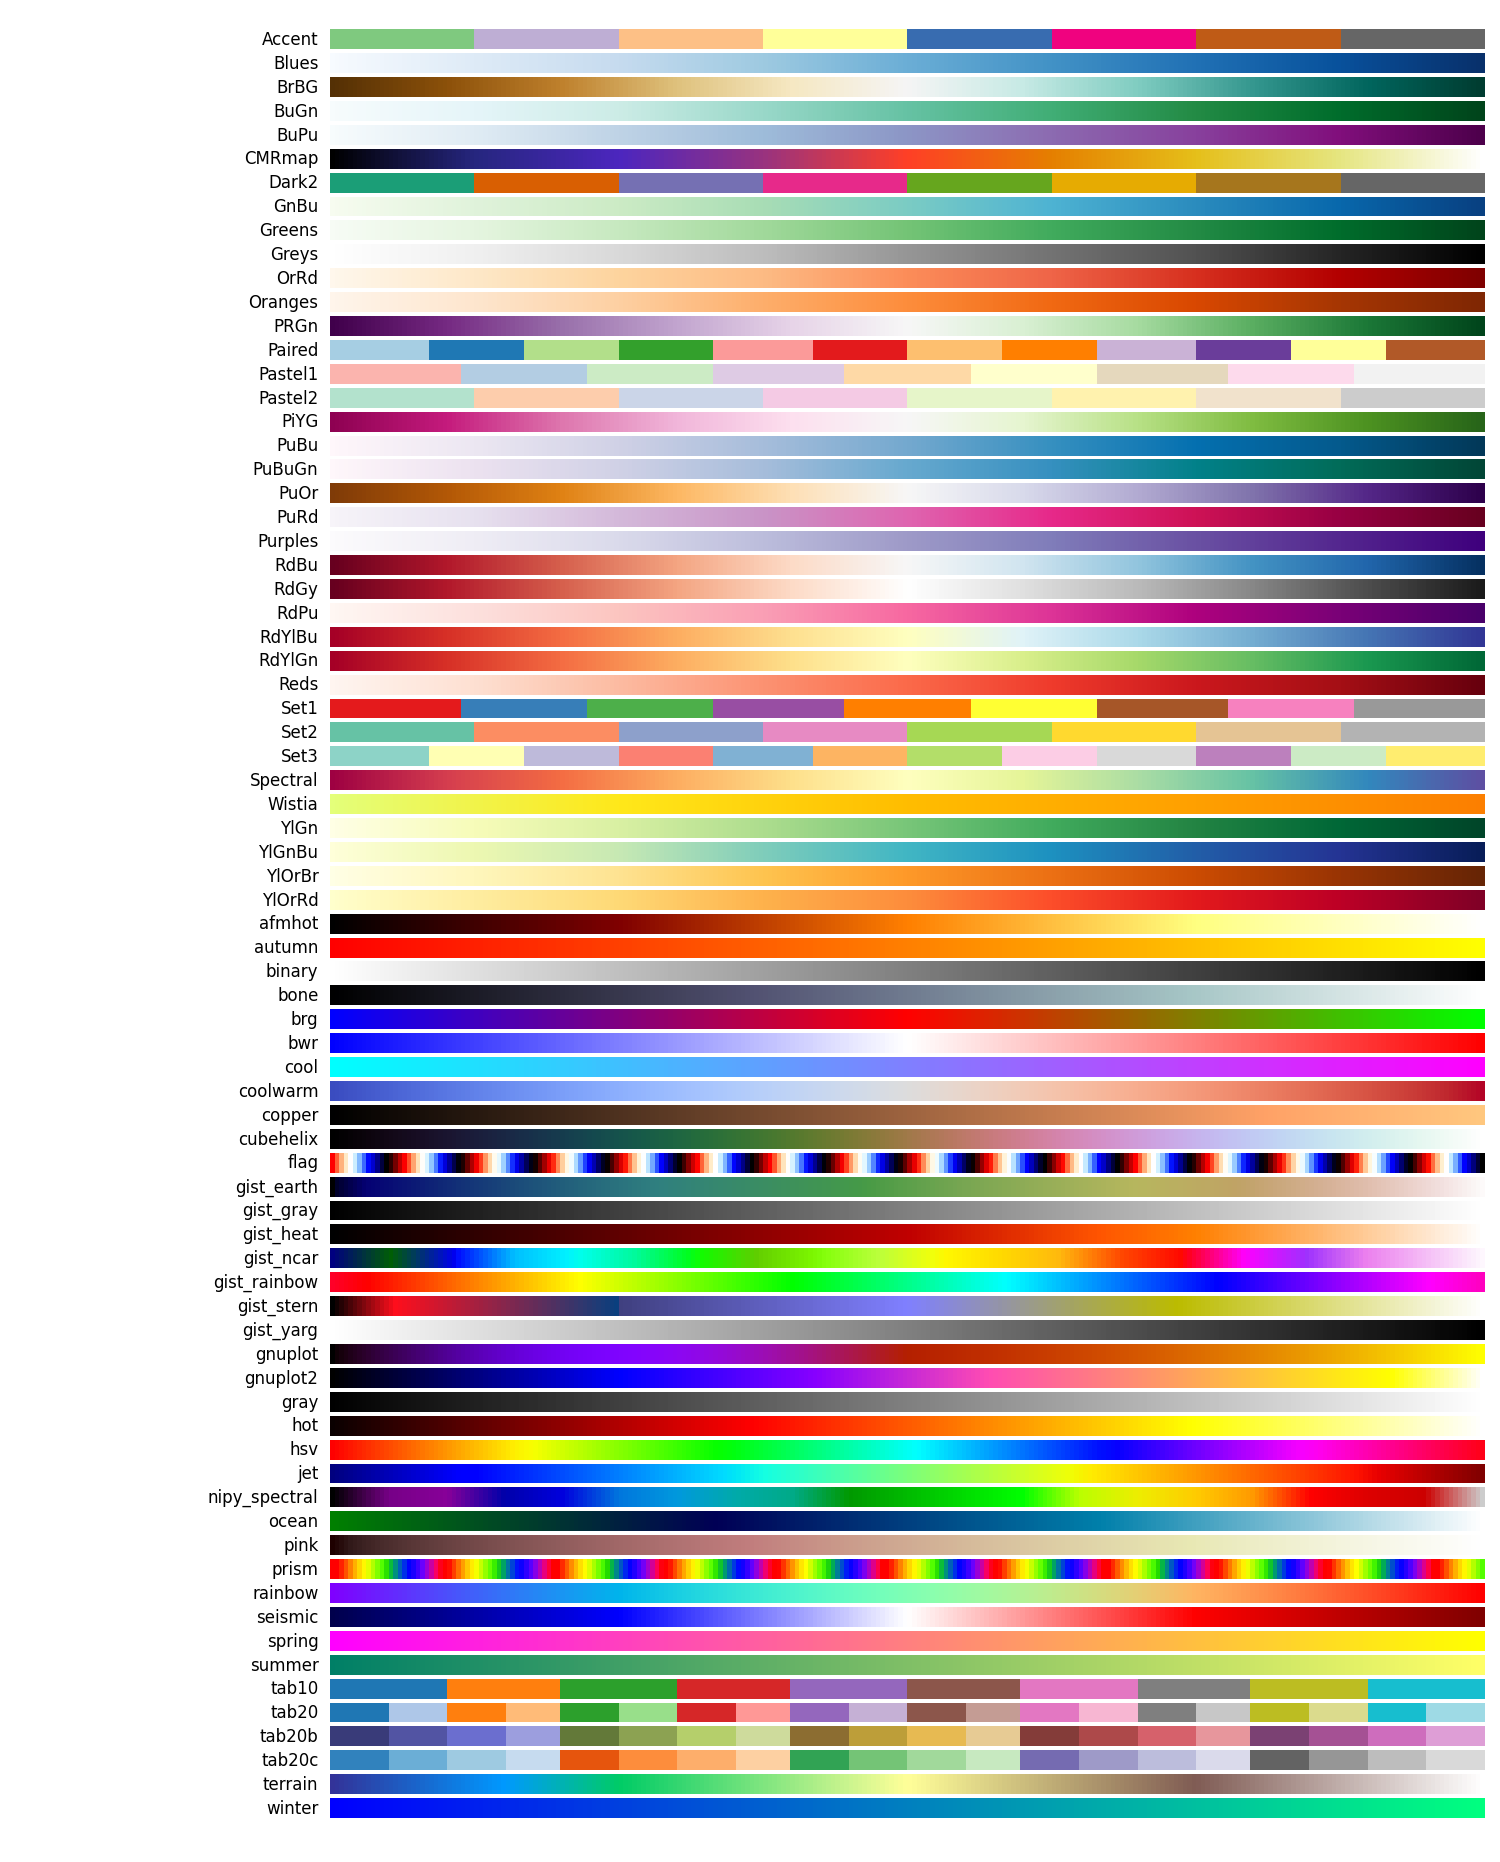
Plot matplotlib color maps
deprecated_cmaps = ["Vega10", "Vega20", "Vega20b", "Vega20c", "spectral"]
m_cmaps = [
    m
    for m in plt.cm.datad
    if not m.endswith("_r") and m not in deprecated_cmaps
]

plot_color_gradients(m_cmaps)

show()
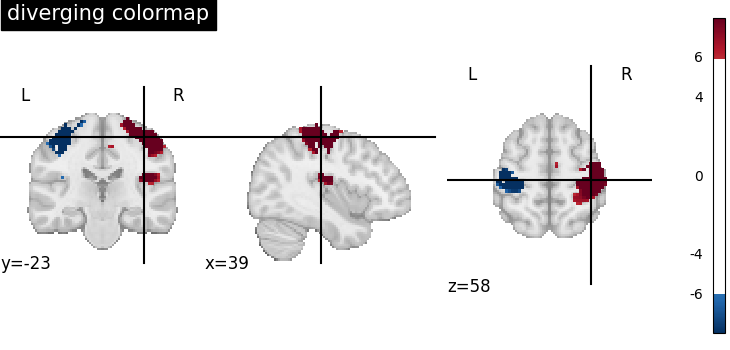
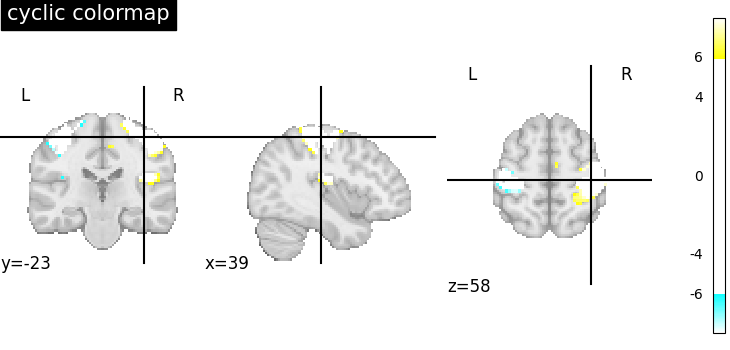
Choosing colormaps
Some of the cyclic colormaps
shipped with nilearn (like "cold_hot") will have the same values
for very large and very small values,
making it hard to distinguish ‘activations’ from ‘deactivations’.
In this case, you may want to use
a proper diverging colormaps
(like "RdBu_r", the default for many Nilearn plotting functions).
Whatever colormap you choose, we recommend you check that it is perceptually uniform (equal steps in data are perceived as equal steps in the color space) (see the matplotlib documentation <https://matplotlib.org/stable/users/explain/colors/colormaps.html#lightness-of-matplotlib-colormaps> for more information).
from nilearn.datasets import load_sample_motor_activation_image
from nilearn.plotting import plot_stat_map

stat_map = load_sample_motor_activation_image()

plot_stat_map(stat_map, cmap="RdBu_r", threshold=6, title="diverging colormap")
plot_stat_map(stat_map, cmap="cold_hot", threshold=6, title="cyclic colormap")

show()
Total running time of the script: (0 minutes 3.680 seconds)
Estimated memory usage: 138 MB