Note
This page is a reference documentation. It only explains the function signature, and not how to use it. Please refer to the user guide for the big picture.
nilearn.signal.butterworth
- nilearn.signal.butterworth(signals, sampling_rate, low_pass=None, high_pass=None, order=5, padtype='odd', padlen=None, copy=False)[source]
Apply a low-pass, high-pass or band-pass Butterworth filter.
Apply a filter to remove signal below the low frequency and above the high frequency.
- Parameters:
- signals
numpy.ndarray(1D sequence or n_samples x n_sources) Signals to be filtered. A signal is assumed to be a column of signals.
- sampling_rate
float Number of samples per second (sample frequency, in Hertz).
- low_pass
floatorintor None, default=None Low cutoff frequency in Hertz. If specified, signals above this frequency will be filtered out. If
None, no low-pass filtering will be performed.- high_pass
floatorintor None, default=None High cutoff frequency in Hertz. If specified, signals below this frequency will be filtered out.
- order
int, default=5 Order of the Butterworth filter. When filtering signals, the filter has a decay to avoid ringing. Increasing the order sharpens this decay. Be aware that very high orders can lead to numerical instability.
- padtype{“odd”, “even”, “constant”, None}, default=”odd”
Type of padding to use for the Butterworth filter. For more information about this, see
scipy.signal.filtfilt.- padlen
intor None, default=None The size of the padding to add to the beginning and end of
signals. If None, the default value fromscipy.signal.filtfiltwill be used.- copy
bool, default=False If False, signals is modified inplace, and memory consumption is lower than for
copy=True, though computation time is higher.
- signals
- Returns:
- filtered_signals
numpy.ndarray Signals filtered according to the given parameters.
- filtered_signals
Examples
>>> import numpy as np
>>> from nilearn.signal import butterworth
>>>
>>> # Generate a single time series
>>> # and apply Butterworth filter to the signal.
>>> signals = np.random.default_rng(42).standard_normal(size=40)
>>> filtered_signals = butterworth(
...     signals,
...     sampling_rate=1,
...     low_pass=0.25,
...     high_pass=0.12,
...     copy=True
... )
>>>
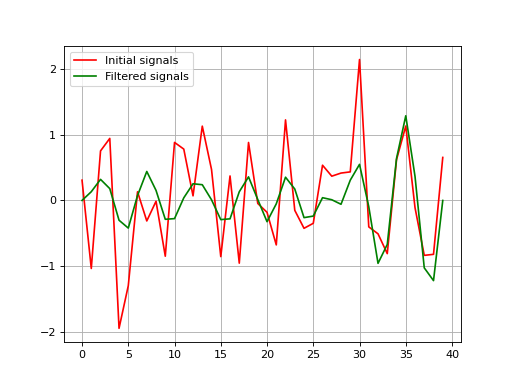
>>> # Plot both signals and filtered_signals
>>> # (if matplotlib is installed).
>>> import matplotlib.pyplot as plt
>>>
>>> fig = plt.plot(signals, color="red")
>>> fig = plt.plot(filtered_signals, color="green")
>>> leg = plt.legend(["Initial signals", "Filtered signals"])
>>> plt.grid(True)
>>> plt.show()