Note
Go to the end to download the full example code. or to run this example in your browser via Binder
Plot Haxby masks
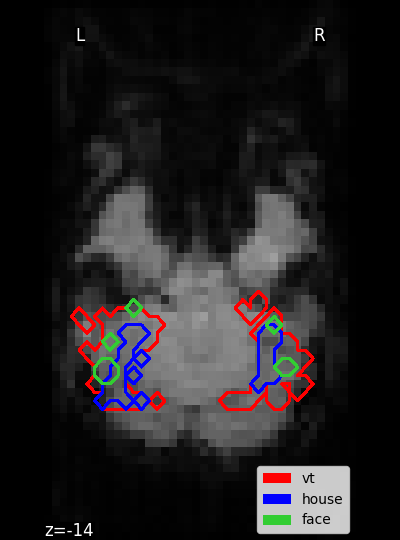
Small script to show how to plot several masks at the same time.
Load Haxby dataset
from nilearn import datasets
from nilearn.plotting import plot_anat, show

haxby_dataset = datasets.fetch_haxby()

# print basic information on the dataset
print(
    f"First subject anatomical nifti image (3D) is at: {haxby_dataset.anat[0]}"
)
[wrapper] Dataset directory found: /home/runner/work/nilearn/nilearn/nilearn_data/haxby2001
First subject anatomical nifti image (3D) is at: /home/runner/work/nilearn/nilearn/nilearn_data/haxby2001/subj2/anat.nii.gz
Plot the masks
Here we will generate a single legend using the trick described on https://matplotlib.org/2.0.2/users/legend_guide.html
import matplotlib.pyplot as plt
from matplotlib.patches import Rectangle

mask_vt_filename = haxby_dataset.mask_vt[0]
mask_house_filename = haxby_dataset.mask_house[0]
mask_face_filename = haxby_dataset.mask_face[0]
masks = [
    mask_vt_filename,
    mask_house_filename,
    mask_face_filename,
]

colors = ["red", "blue", "limegreen"]

z_slice = -14
fig = plt.figure(figsize=(4, 5.4), facecolor="k")
display = plot_anat(
    haxby_dataset.anat[0],
    display_mode="z",
    cut_coords=[z_slice],
    figure=fig,
)

for mask, color in zip(masks, colors, strict=False):
    display.add_contours(
        mask,
        antialiased=False,
        linewidth=4.0,
        levels=[0],
        colors=[color],
    )

p_v = Rectangle((0, 0), 1, 1, fc="red")
p_h = Rectangle((0, 0), 1, 1, fc="blue")
p_f = Rectangle((0, 0), 1, 1, fc="limegreen")
plt.legend(
    [p_v, p_h, p_f],
    ["vt", "house", "face"],
    loc="lower right",
)

show()
/home/runner/work/nilearn/nilearn/.tox/doc/lib/python3.11/site-packages/nilearn/plotting/displays/_axes.py:98: UserWarning:

The following kwargs were not used by contour: 'linewidth'
Total running time of the script: (0 minutes 1.204 seconds)
Estimated memory usage: 186 MB
