Note
Go to the end to download the full example code. or to run this example in your browser via JupyterLite or Binder
Resample an image to a template
The goal of this example is to illustrate the use of the function
resample_to_img to resample an image to a template.
We use the MNI152 template as the reference for resampling a t-map image.
Function resample_img
could also be used to achieve this.
First we load the required datasets using the nilearn datasets module.
from nilearn.datasets import (
    load_mni152_template,
    load_sample_motor_activation_image,
)

template = load_mni152_template(resolution=2)

stat_img = load_sample_motor_activation_image()
Now, the motor contrast map image can be resampled to the MNI template image.
from nilearn.image import resample_to_img

resampled_stat_img = resample_to_img(stat_img, template)
Let’s check the shape and affine have been correctly updated.
# First load the original t-map in memory:
from nilearn.image import load_img

tmap_img = load_img(stat_img)

original_shape = tmap_img.shape
original_affine = tmap_img.affine

resampled_shape = resampled_stat_img.shape
resampled_affine = resampled_stat_img.affine

template_img = load_img(template)
template_shape = template_img.shape
template_affine = template_img.affine
print(
    f"""Shape comparison:
- Original t-map image shape : {original_shape}
- Resampled t-map image shape: {resampled_shape}
- Template image shape       : {template_shape}
"""
)

print(
    f"""Affine comparison:
- Original t-map image affine :
 {original_affine}
- Resampled t-map image affine:
 {resampled_affine}
- Template image affine       :
 {template_affine}
"""
)
Shape comparison:
- Original t-map image shape : (53, 63, 46)
- Resampled t-map image shape: (99, 117, 95)
- Template image shape       : (99, 117, 95)

Affine comparison:
- Original t-map image affine :
 [[  -3.    0.    0.   78.]
 [   0.    3.    0. -112.]
 [   0.    0.    3.  -50.]
 [   0.    0.    0.    1.]]
- Resampled t-map image affine:
 [[   2.    0.    0.  -98.]
 [   0.    2.    0. -134.]
 [   0.    0.    2.  -72.]
 [   0.    0.    0.    1.]]
- Template image affine       :
 [[   2.    0.    0.  -98.]
 [   0.    2.    0. -134.]
 [   0.    0.    2.  -72.]
 [   0.    0.    0.    1.]]
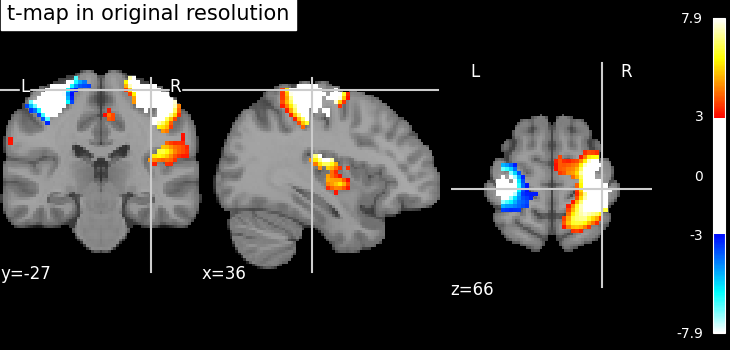
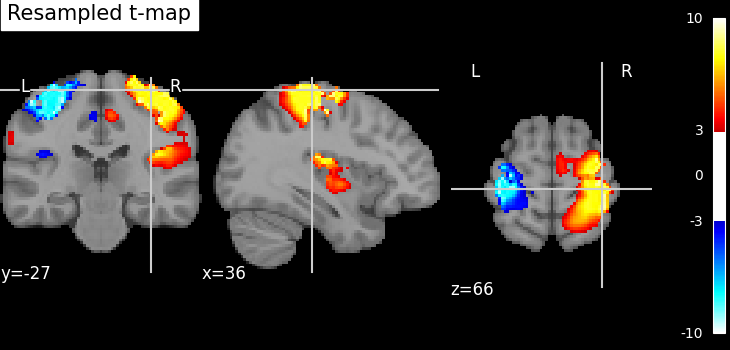
Finally, result images are displayed using nilearn plotting module.
from nilearn import plotting

plotting.plot_stat_map(
    stat_img,
    bg_img=template,
    cut_coords=(36, -27, 66),
    threshold=3,
    title="t-map in original resolution",
    vmax=8,
)
plotting.plot_stat_map(
    resampled_stat_img,
    bg_img=template,
    cut_coords=(36, -27, 66),
    threshold=3,
    title="Resampled t-map",
    vmax=8,
)
plotting.show()
Total running time of the script: (0 minutes 2.020 seconds)
Estimated memory usage: 145 MB