Note
This page is a reference documentation. It only explains the function signature, and not how to use it. Please refer to the user guide for the big picture.
nilearn.plotting.plot_connectome
- nilearn.plotting.plot_connectome(adjacency_matrix, node_coords, node_color='auto', node_size=50, edge_cmap='RdBu_r', edge_vmin=None, edge_vmax=None, edge_threshold=None, output_file=None, display_mode='ortho', figure=None, axes=None, title=None, annotate=True, black_bg=False, alpha=0.7, edge_kwargs=None, node_kwargs=None, colorbar=True, radiological=False)[source]
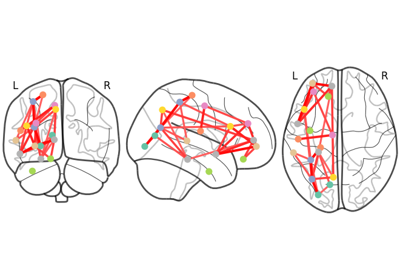
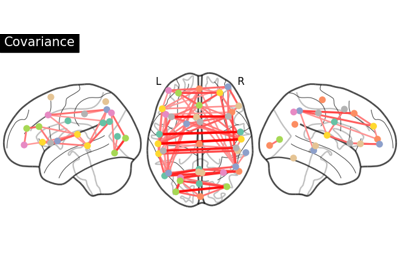
Plot connectome on top of the brain glass schematics.
The plotted image should be in MNI space for this function to work properly.
In the case of ‘l’ and ‘r’ directions (for hemispheric projections), markers in the coordinate x == 0 are included in both hemispheres.
- Parameters:
- adjacency_matrixnumpy array of shape (n, n)
Represents the link strengths of the graph. The matrix can be symmetric which will result in an undirected graph, or not symmetric which will result in a directed graph.
- node_coordsnumpy array_like of shape (n, 3)
3d coordinates of the graph nodes in world space.
- node_colorcolor or sequence of colors or ‘auto’, default=’auto’
Color(s) of the nodes. If string is given, all nodes are plotted with same color given in string.
- node_sizescalar or array_like, default=50
Size(s) of the nodes in points^2.
- edge_cmapcolormap, default=”RdBu_r”
Colormap used for representing the strength of the edges.
- edge_vmin, edge_vmax
floator None, Default=None If not None, either or both of these values will be used to as the minimum and maximum values to color edges. If None are supplied the maximum absolute value within the given threshold will be used as minimum (multiplied by -1) and maximum coloring levels.
- edge_threshold
str, number or None, Default=None If it is a number only the edges with a value greater than edge_threshold will be shown. If it is a string it must finish with a percent sign, e.g. “25.3%”, and only the edges with a abs(value) above the given percentile will be shown.
- output_file
strorpathlib.Pathor None, default=None The name of an image file to export the plot to. Valid extensions are .png, .pdf, .svg. If output_file is not None, the plot is saved to a file, and the display is closed.
- display_mode
str, default=’ortho’ Choose the direction of the cuts: ‘x’ - sagittal, ‘y’ - coronal, ‘z’ - axial, ‘l’ - sagittal left hemisphere only, ‘r’ - sagittal right hemisphere only, ‘ortho’ - three cuts are performed in orthogonal directions. Possible values are: ‘ortho’, ‘x’, ‘y’, ‘z’, ‘xz’, ‘yx’, ‘yz’, ‘l’, ‘r’, ‘lr’, ‘lzr’, ‘lyr’, ‘lzry’, ‘lyrz’.
- figure
int, ormatplotlib.figure.Figure, or None, optional Matplotlib figure used or its number. If None is given, a new figure is created.
- axes
matplotlib.axes.Axes, or 4tupleoffloat: (xmin, ymin, width, height), default=None The axes, or the coordinates, in matplotlib figure space, of the axes used to display the plot. If None, the complete figure is used.
- title
str, or None, default=None The title displayed on the figure.
- annotate
bool, default=True If annotate is True (like positions and / or left/right annotation) are added to the plot.
- black_bg
bool, or “auto”, optional If True, the background of the image is set to be black. If you wish to save figures with a black background, you will need to pass facecolor=”k”, edgecolor=”k” to
matplotlib.pyplot.savefig. Default=False.- alpha
floatbetween 0 and 1, default=0.7 Alpha transparency for the brain schematics.
- edge_kwargs
dictor None, default=None Will be passed as kwargs for each edge matlotlib Line2D.
- node_kwargs
dictor None, default=None Will be passed as kwargs to the plt.scatter call that plots all the nodes in one go.
- colorbar
bool, optional If True, display a colorbar next to the plots. Default=True.
- radiological
bool, default=False Invert x axis and R L labels to plot sections as a radiological view. If False (default), the left hemisphere is on the left of a coronal image. If True, left hemisphere is on the right.
- Returns:
- display
OrthoProjectoror None An instance of the OrthoProjector class. If
output_fileis defined, None is returned.
- display
See also
nilearn.plotting.find_parcellation_cut_coordsExtraction of node coords on brain parcellations.
nilearn.plotting.find_probabilistic_atlas_cut_coordsExtraction of node coords on brain probabilistic atlases.
Examples using nilearn.plotting.plot_connectome
Classification of age groups using functional connectivity
Comparing connectomes on different reference atlases
Computing a connectome with sparse inverse covariance
Extracting signals of a probabilistic atlas of functional regions
Group Sparse inverse covariance for multi-subject connectome
Regions extraction using dictionary learning and functional connectomes