Note
Go to the end to download the full example code. or to run this example in your browser via JupyterLite or Binder
Visualizing multiscale functional brain parcellations
This example shows how to download and fetch brain parcellations of
multiple networks using
fetch_atlas_basc_multiscale_2015
and visualize them using plotting function plot_roi.
We show here only three different networks of ‘symmetric’ version. For more details about different versions and different networks, please refer to its documentation.
Retrieving multiscale group brain parcellations
# import datasets module and use `fetch_atlas_basc_multiscale_2015` function
from nilearn.datasets import fetch_atlas_basc_multiscale_2015
parcellations = [
fetch_atlas_basc_multiscale_2015(version="sym", resolution=64),
fetch_atlas_basc_multiscale_2015(version="sym", resolution=197),
fetch_atlas_basc_multiscale_2015(version="sym", resolution=444),
]
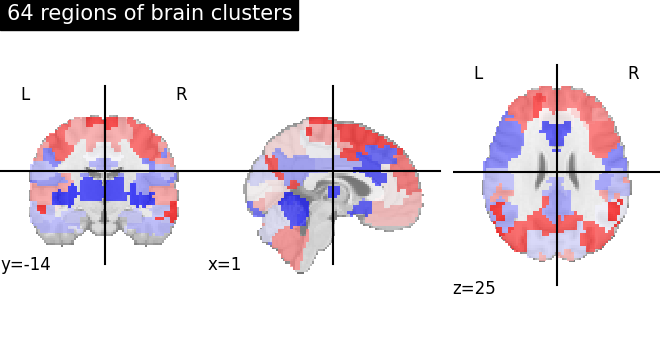
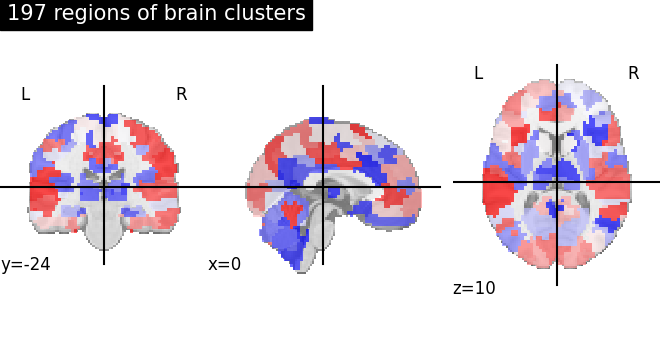
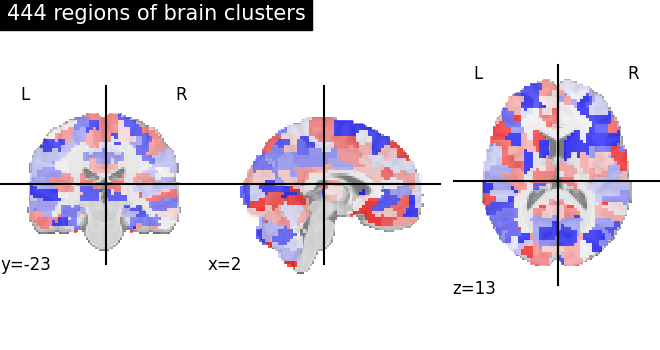
# We show here networks of 64, 197, 444
networks_64 = parcellations[0]["maps"]
networks_197 = parcellations[1]["maps"]
networks_444 = parcellations[2]["maps"]
[fetch_atlas_basc_multiscale_2015] Dataset created in
/home/runner/nilearn_data/basc_multiscale_2015
[fetch_atlas_basc_multiscale_2015] Downloading data from
https://ndownloader.figshare.com/files/1861819 ...
[fetch_atlas_basc_multiscale_2015]  ...done. (2 seconds, 0 min)

[fetch_atlas_basc_multiscale_2015] Extracting data from /home/runner/nilearn_dat
a/basc_multiscale_2015/5fd26f33e54da6efc0bc7eca321ad622/1861819...
[fetch_atlas_basc_multiscale_2015] .. done.

[fetch_atlas_basc_multiscale_2015] Dataset directory found:
/home/runner/nilearn_data/basc_multiscale_2015
[fetch_atlas_basc_multiscale_2015] Dataset directory found:
/home/runner/nilearn_data/basc_multiscale_2015
Visualizing brain parcellations
# import plotting module and use `plot_roi` function, since the maps are in 3D
from nilearn.plotting import plot_roi, show

# The coordinates of all plots are selected automatically by itself
# We manually change the colormap of our choice
plot_roi(networks_64, cmap="bwr", title="64 regions of brain clusters")

plot_roi(networks_197, cmap="bwr", title="197 regions of brain clusters")

plot_roi(networks_444, cmap="bwr_r", title="444 regions of brain clusters")

show()
Total running time of the script: (0 minutes 3.256 seconds)
Estimated memory usage: 145 MB