Note
This page is a reference documentation. It only explains the function signature, and not how to use it. Please refer to the user guide for the big picture.
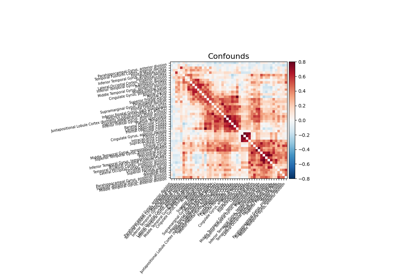
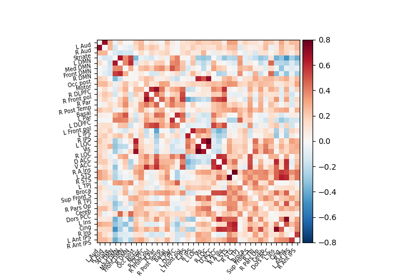
nilearn.plotting.plot_matrix
- nilearn.plotting.plot_matrix(mat, title=None, labels=None, figure=None, axes=None, colorbar=True, cmap='RdBu_r', tri='full', auto_fit=True, grid=False, reorder=False, **kwargs)[source]
Plot the given matrix.
- Parameters:
- mat2-D
numpy.ndarray Matrix to be plotted.
- title
str, or None, default=None The title displayed on the figure.
- labels
list, ornumpy.ndarrayofstr, or False, or None, default=None The label of each row and column. Needs to be the same length as rows/columns of mat. If False, None, or an empty list, no labels are plotted.
- figure
matplotlib.figure.Figure, figsizetuple, or None, default=None Sets the figure used. This argument can be either an existing figure, or a pair (width, height) that gives the size of a newly-created figure.
Note
Specifying both axes and figure is not allowed.
- axesNone or
matplotlib.axes.Axes, default=None Axes instance to be plotted on. Creates a new one if None.
Note
Specifying both axes and figure is not allowed.
- colorbar
bool, optional If True, display a colorbar next to the plots. Default=True.
- cmap
matplotlib.colors.Colormap, orstr, optional The colormap to use. Either a string which is a name of a matplotlib colormap, or a matplotlib colormap object. default=”RdBu_r”
- tri{‘full’, ‘lower’, ‘diag’}, default=’full’
Which triangular part of the matrix to plot:
‘lower’: Plot the lower part
‘diag’: Plot the lower part with the diagonal
‘full’: Plot the full matrix
- auto_fit
bool, default=True If auto_fit is True, the axes are dimensioned to give room for the labels. This assumes that the labels are resting against the bottom and left edges of the figure.
- gridcolor or False, default=False
If not False, a grid is plotted to separate rows and columns using the given color.
- reorder
boolor {‘single’, ‘complete’, ‘average’}, default=False If not False, reorders the matrix into blocks of clusters. Accepted linkage options for the clustering are ‘single’, ‘complete’, and ‘average’. True defaults to average linkage.
Note
This option is only available with SciPy >= 1.0.0.
Added in Nilearn 0.4.1.
- kwargsextra keyword arguments, optional
Extra keyword arguments are sent to pylab.imshow.
- mat2-D
- Returns:
- display
matplotlib.axes.Axes Axes image.
- display
Examples using nilearn.plotting.plot_matrix
Visualizing Megatrawls Network Matrices from Human Connectome Project
Decoding with FREM: face vs house vs chair object recognition
The haxby dataset: different multi-class strategies
Classification of age groups using functional connectivity
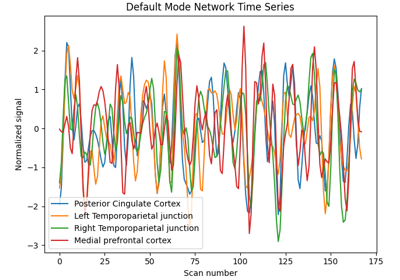
Computing a connectome with sparse inverse covariance
Connectivity structure estimation on simulated data
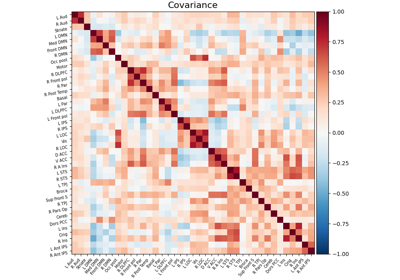
Extracting signals of a probabilistic atlas of functional regions
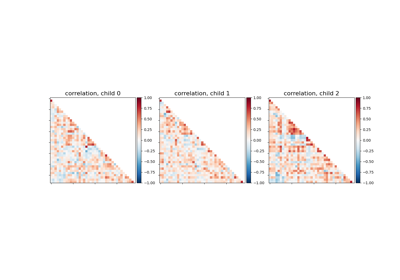
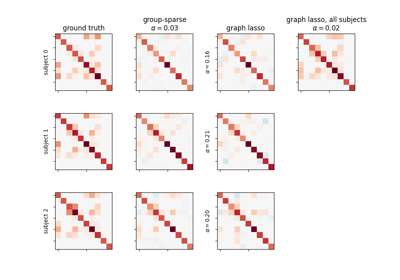
Group Sparse inverse covariance for multi-subject connectome
Regions extraction using dictionary learning and functional connectomes