Note
Go to the end to download the full example code. or to run this example in your browser via JupyterLite or Binder
Breaking an atlas of labels in separated regions
This example shows how to use
connected_label_regions
to assign each spatially-separated region of the atlas a unique label.
Indeed, often in a given atlas of labels, the same label (number) may be used in different connected regions, for instance a region in each hemisphere. If we want to operate on regions and not networks (for instance in signal extraction), it is useful to assign a different label to each region. We end up with a new atlas that has more labels, but each one points to a single region.
We use the Yeo atlas as an example for labeling regions,
fetch_atlas_yeo_2011
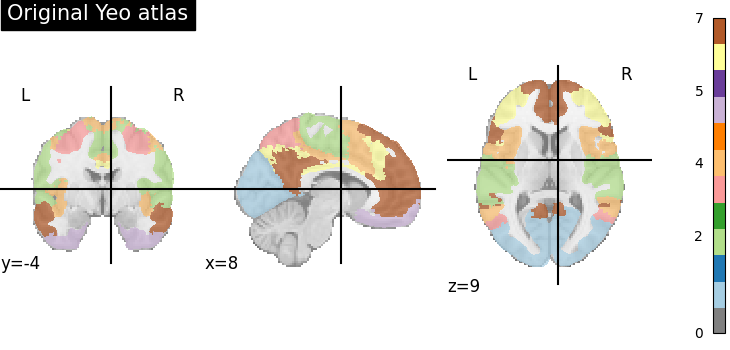
The original Yeo atlas
# First we fetch the Yeo atlas

from nilearn.datasets import fetch_atlas_yeo_2011
from nilearn.plotting import plot_roi, show

atlas_yeo_2011 = fetch_atlas_yeo_2011()

atlas_yeo = atlas_yeo_2011.maps

# Let's now plot it
plot_roi(
    atlas_yeo,
    title="Original Yeo atlas",
    cut_coords=(8, -4, 9),
    cmap="Paired",
)

show()
[fetch_atlas_yeo_2011] Dataset directory found:
/home/runner/nilearn_data/yeo_2011
The original Yeo atlas has 7 labels, that is indicated in the colorbar. The colorbar also shows the correspondence between the color and the label
Note that these 7 labels correspond actually to networks that comprise several regions. We are going to split them up.
Relabeling the atlas into separated regions
Now we use the connected_label_regions to break apart the networks of the Yeo atlas into separated regions
from nilearn.regions import connected_label_regions

region_labels = connected_label_regions(atlas_yeo)
Plotting the new regions
plot_roi(
    region_labels,
    title="Relabeled Yeo atlas",
    cut_coords=(8, -4, 9),
    cmap="Paired",
)

show()
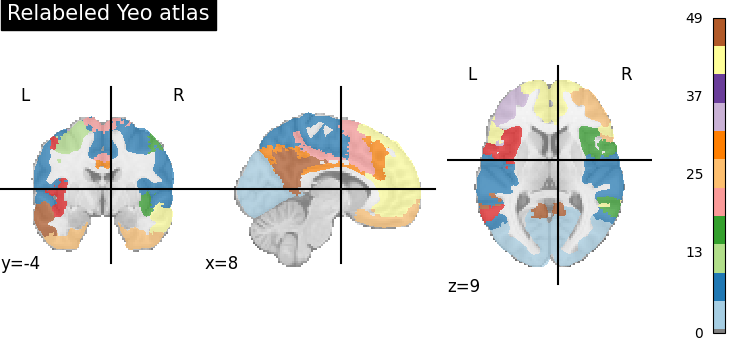
Note that the same cluster in original and labeled atlas could have different color, so, you cannot directly compare colors.
However, you can see that the regions in the left and right hemispheres now have different colors. For some regions it is difficult to tell apart visually, as the colors are too close on the colormap (eg in the blue: regions labeled around 3).
Also, we can see that there are many more labels: the colorbar goes up to 49. The 7 networks of the Yeo atlas are now broken up into 49 ROIs.
You can save the new atlas to a nifti file using to_filename method.
from pathlib import Path

output_dir = Path.cwd() / "results" / "plot_extract_regions_labels_image"
output_dir.mkdir(exist_ok=True, parents=True)
print(f"Output will be saved to: {output_dir}")

region_labels.to_filename(output_dir / "relabeled_yeo_atlas.nii.gz")
Output will be saved to: /home/runner/work/nilearn/nilearn/examples/06_manipulating_images/results/plot_extract_regions_labels_image
Different connectivity modes
Using the parameter connect_diag=False we separate in addition two regions that are connected only along the diagonal.
region_labels_not_diag = connected_label_regions(atlas_yeo, connect_diag=False)

plot_roi(
    region_labels_not_diag,
    title="Relabeling and connect_diag=False",
    cut_coords=(8, -4, 9),
    cmap="Paired",
)

show()
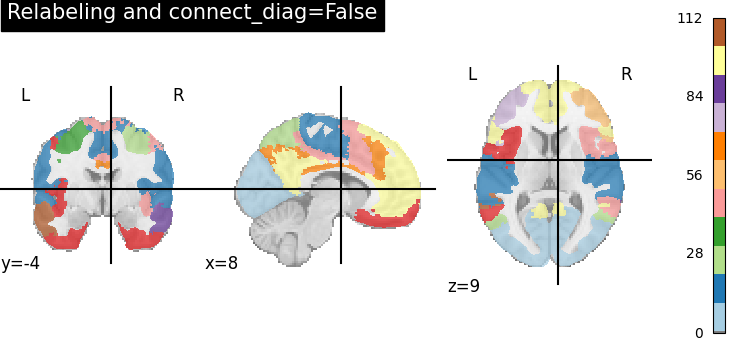
A consequence of using connect_diag=False is that we can get a lot of small regions, around 110 judging from the colorbar.
Hence we suggest use connect_diag=True
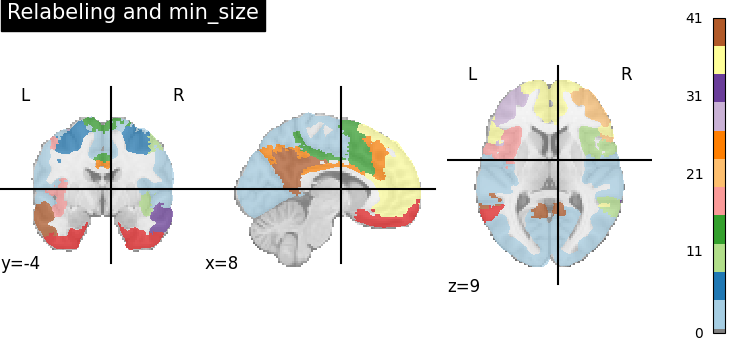
Parameter min_size
In the above, we get around 110 regions, but many of these are very small. We can remove them with the min_size parameter, keeping only the regions larger than 100mm^3.
region_labels_min_size = connected_label_regions(
    atlas_yeo, min_size=100, connect_diag=False
)

plot_roi(
    region_labels_min_size,
    title="Relabeling and min_size",
    cut_coords=(8, -4, 9),
    cmap="Paired",
)

show()
Total running time of the script: (0 minutes 22.121 seconds)
Estimated memory usage: 863 MB