Note
Go to the end to download the full example code. or to run this example in your browser via JupyterLite or Binder
Voxel-Based Morphometry on Oasis dataset
This example uses Voxel-Based Morphometry (VBM) to study the relationship between aging and gray matter density.
The data come from the OASIS project. If you use it, you need to agree with the data usage agreement available on the website.
It has been run through a standard VBM pipeline (using SPM8 and NewSegment) to create VBM maps, which we study here.
Predictive modeling analysis: VBM bio-markers of aging?
We run a standard SVM-ANOVA nilearn pipeline to predict age from the VBM data. We use only 100 subjects from the OASIS dataset to limit the memory usage.
Note that for an actual predictive modeling study of aging, the study should be ran on the full set of subjects. Also, all parameters should be set by cross-validation. This includes the smoothing applied to the data and the number of features selected by the ANOVA step. Indeed, even these data-preparation parameter impact significantly the prediction score.
Also, parameters such as the smoothing should be applied to the data and the number of features selected by the ANOVA step should be set by nested cross-validation, as they impact significantly the prediction score.
Brain mapping with mass univariate
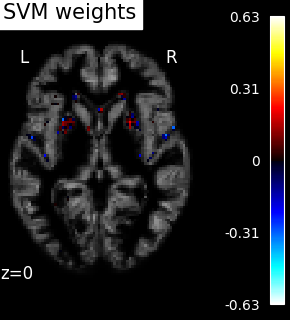
SVM weights are very noisy, partly because heavy smoothing is detrimental for the prediction here. A standard analysis using mass-univariate GLM (here permuted to have exact correction for multiple comparisons) gives a much clearer view of the important regions.
See also
For more information see the dataset description.
import numpy as np

from nilearn.datasets import fetch_oasis_vbm
from nilearn.image import get_data
from nilearn.maskers import NiftiMasker

n_subjects = 200  # more subjects requires more memory
Load Oasis dataset
oasis_dataset = fetch_oasis_vbm(n_subjects=n_subjects)
gray_matter_map_filenames = oasis_dataset.gray_matter_maps
age = oasis_dataset.ext_vars["age"].to_numpy()

# Split data into training set and test set
from sklearn.model_selection import train_test_split

gm_imgs_train, gm_imgs_test, age_train, age_test = train_test_split(
    gray_matter_map_filenames, age, train_size=0.6, random_state=0
)

# print basic information on the dataset
print(
    "First gray-matter anatomy image (3D) is located at: "
    f"{oasis_dataset.gray_matter_maps[0]}"
)
print(
    "First white-matter anatomy image (3D) is located at: "
    f"{oasis_dataset.white_matter_maps[0]}"
)
[fetch_oasis_vbm] Dataset directory found: /home/runner/nilearn_data/oasis1
First gray-matter anatomy image (3D) is located at: /home/runner/nilearn_data/oasis1/OAS1_0001_MR1/mwrc1OAS1_0001_MR1_mpr_anon_fslswapdim_bet.nii.gz
First white-matter anatomy image (3D) is located at: /home/runner/nilearn_data/oasis1/OAS1_0001_MR1/mwrc2OAS1_0001_MR1_mpr_anon_fslswapdim_bet.nii.gz
Preprocess data
The features with too low between-subject variance are removed using
sklearn.feature_selection.VarianceThreshold.
Then we convert the data back to the mask image in order to use it for
decoding process
nifti_masker = NiftiMasker(
    standardize=False, smoothing_fwhm=2, memory="nilearn_cache", verbose=1
)  # cache options
gm_maps_masked = nifti_masker.fit_transform(gm_imgs_train)

from sklearn.feature_selection import VarianceThreshold

variance_threshold = VarianceThreshold(threshold=0.01)
variance_threshold.fit_transform(gm_maps_masked)

mask = nifti_masker.inverse_transform(variance_threshold.get_support())
\[NiftiMasker.wrapped] Loading data from ['/home/runner/nilearn_data/oasis1/OAS1
_0211_MR1/mwrc1OAS1_0211_MR1_mpr_anon_fslswapdim_bet.nii.gz', '/home/runner/nile
arn_data/oasis1/OAS1_0052_MR1/mwrc1OAS1_0052_MR1_mpr_anon_fslswapdim_bet.nii.gz'
, '/home/runner/nilearn_data/oasis1/OAS1_0155_MR1/mwrc1OAS1_0155_MR1_mpr_anon_fs
lswapdim_bet.nii.gz', '/home/runner/nilearn_data/oasis1/OAS1_0221_MR1/mwrc1OAS1_
0221_MR1_mpr_anon_fslswapdim_bet.nii.gz', '/home/runner/nilearn_data/oasis1/OAS1
_0121_MR1/mwrc1OAS1_0121_MR1_mpr_anon_fslswapdim_bet.nii.gz', '/home/runner/nile
arn_data/oasis1/OAS1_0070_MR1/mwrc1OAS1_0070_MR1_mpr_anon_fslswapdim_bet.nii.gz'
, '/home/runner/nilearn_data/oasis1/OAS1_0003_MR1/mwrc1OAS1_0003_MR1_mpr_anon_fs
lswapdim_bet.nii.gz', '/home/runner/nilearn_data/oasis1/OAS1_0067_MR1/mwrc1OAS1_
0067_MR1_mpr_anon_fslswapdim_bet.nii.gz', '/home/runner/nilearn_data/oasis1/OAS1
_0152_MR1/mwrc1OAS1_0152_MR1_mpr_anon_fslswapdim_bet.nii.gz', '/home/runner/nile
arn_data/oasis1/OAS1_0224_MR1/mwrc1OAS1_0224_MR1_mpr_anon_fslswapdim_bet.nii.gz'
, '/home/runner/nilearn_data/oasis1/OAS1_0049_MR1/mwrc1OAS1_0049_MR1_mpr_anon_fs
lswapdim_bet.nii.gz', '/home/runner/nilearn_data/oasis1/OAS1_0012_MR1/mwrc1OAS1_
0012_MR1_mpr_anon_fslswapdim_bet.nii.gz', '/home/runner/nilearn_data/oasis1/OAS1
_0220_MR1/mwrc1OAS1_0220_MR1_mpr_anon_fslswapdim_bet.nii.gz', '/home/runner/nile
arn_data/oasis1/OAS1_0081_MR1/mwrc1OAS1_0081_MR1_mpr_anon_fslswapdim_bet.nii.gz'
, '/home/runner/nilearn_data/oasis1/OAS1_0223_MR1/mwrc1OAS1_0223_MR1_mpr_anon_fs
lswapdim_bet.nii.gz', '/home/runner/nilearn_data/oasis1/OAS1_0202_MR1/mwrc1OAS1_
0202_MR1_mpr_anon_fslswapdim_bet.nii.gz', '/home/runner/nilearn_data/oasis1/OAS1
_0199_MR1/mwrc1OAS1_0199_MR1_mpr_anon_fslswapdim_bet.nii.gz', '/home/runner/nile
arn_data/oasis1/OAS1_0141_MR1/mwrc1OAS1_0141_MR1_mpr_anon_fslswapdim_bet.nii.gz'
, '/home/runner/nilearn_data/oasis1/OAS1_0105_MR1/mwrc1OAS1_0105_MR1_mpr_anon_fs
lswapdim_bet.nii.gz', '/home/runner/nilearn_data/oasis1/OAS1_0126_MR1/mwrc1OAS1_
0126_MR1_mpr_anon_fslswapdim_bet.nii.gz', '/home/runner/nilearn_data/oasis1/OAS1
_0179_MR1/mwrc1OAS1_0179_MR1_mpr_anon_fslswapdim_bet.nii.gz', '/home/runner/nile
arn_data/oasis1/OAS1_0216_MR1/mwrc1OAS1_0216_MR1_mpr_anon_fslswapdim_bet.nii.gz'
, '/home/runner/nilearn_data/oasis1/OAS1_0056_MR1/mwrc1OAS1_0056_MR1_mpr_anon_fs
lswapdim_bet.nii.gz', '/home/runner/nilearn_data/oasis1/OAS1_0001_MR1/mwrc1OAS1_
0001_MR1_mpr_anon_fslswapdim_bet.nii.gz', '/home/runner/nilearn_data/oasis1/OAS1
_0106_MR1/mwrc1OAS1_0106_MR1_mpr_anon_fslswapdim_bet.nii.gz', '/home/runner/nile
arn_data/oasis1/OAS1_0124_MR1/mwrc1OAS1_0124_MR1_mpr_anon_fslswapdim_bet.nii.gz'
, '/home/runner/nilearn_data/oasis1/OAS1_0107_MR1/mwrc1OAS1_0107_MR1_mpr_anon_fs
lswapdim_bet.nii.gz', '/home/runner/nilearn_data/oasis1/OAS1_0072_MR1/mwrc1OAS1_
0072_MR1_mpr_anon_fslswapdim_bet.nii.gz', '/home/runner/nilearn_data/oasis1/OAS1
_0189_MR1/mwrc1OAS1_0189_MR1_mpr_anon_fslswapdim_bet.nii.gz', '/home/runner/nile
arn_data/oasis1/OAS1_0046_MR1/mwrc1OAS1_0046_MR1_mpr_anon_fslswapdim_bet.nii.gz'
, '/home/runner/nilearn_data/oasis1/OAS1_0077_MR1/mwrc1OAS1_0077_MR1_mpr_anon_fs
lswapdim_bet.nii.gz', '/home/runner/nilearn_data/oasis1/OAS1_0055_MR1/mwrc1OAS1_
0055_MR1_mpr_anon_fslswapdim_bet.nii.gz', '/home/runner/nilearn_data/oasis1/OAS1
_0054_MR1/mwrc1OAS1_0054_MR1_mpr_anon_fslswapdim_bet.nii.gz', '/home/runner/nile
arn_data/oasis1/OAS1_0096_MR1/mwrc1OAS1_0096_MR1_mpr_anon_fslswapdim_bet.nii.gz'
, '/home/runner/nilearn_data/oasis1/OAS1_0015_MR1/mwrc1OAS1_0015_MR1_mpr_anon_fs
lswapdim_bet.nii.gz', '/home/runner/nilearn_data/oasis1/OAS1_0182_MR1/mwrc1OAS1_
0182_MR1_mpr_anon_fslswapdim_bet.nii.gz', '/home/runner/nilearn_data/oasis1/OAS1
_0026_MR1/mwrc1OAS1_0026_MR1_mpr_anon_fslswapdim_bet.nii.gz', '/home/runner/nile
arn_data/oasis1/OAS1_0210_MR1/mwrc1OAS1_0210_MR1_mpr_anon_fslswapdim_bet.nii.gz'
, '/home/runner/nilearn_data/oasis1/OAS1_0151_MR1/mwrc1OAS1_0151_MR1_mpr_anon_fs
lswapdim_bet.nii.gz', '/home/runner/nilearn_data/oasis1/OAS1_0022_MR1/mwrc1OAS1_
0022_MR1_mpr_anon_fslswapdim_bet.nii.gz', '/home/runner/nilearn_data/oasis1/OAS1
_0017_MR1/mwrc1OAS1_0017_MR1_mpr_anon_fslswapdim_bet.nii.gz', '/home/runner/nile
arn_data/oasis1/OAS1_0087_MR1/mwrc1OAS1_0087_MR1_mpr_anon_fslswapdim_bet.nii.gz'
, '/home/runner/nilearn_data/oasis1/OAS1_0116_MR1/mwrc1OAS1_0116_MR1_mpr_anon_fs
lswapdim_bet.nii.gz', '/home/runner/nilearn_data/oasis1/OAS1_0059_MR1/mwrc1OAS1_
0059_MR1_mpr_anon_fslswapdim_bet.nii.gz', '/home/runner/nilearn_data/oasis1/OAS1
_0112_MR1/mwrc1OAS1_0112_MR1_mpr_anon_fslswapdim_bet.nii.gz', '/home/runner/nile
arn_data/oasis1/OAS1_0085_MR1/mwrc1OAS1_0085_MR1_mpr_anon_fslswapdim_bet.nii.gz'
, '/home/runner/nilearn_data/oasis1/OAS1_0004_MR1/mwrc1OAS1_0004_MR1_mpr_anon_fs
lswapdim_bet.nii.gz', '/home/runner/nilearn_data/oasis1/OAS1_0131_MR1/mwrc1OAS1_
0131_MR1_mpr_anon_fslswapdim_bet.nii.gz', '/home/runner/nilearn_data/oasis1/OAS1
_0185_MR1/mwrc1OAS1_0185_MR1_mpr_anon_fslswapdim_bet.nii.gz', '/home/runner/nile
arn_data/oasis1/OAS1_0226_MR1/mwrc1OAS1_0226_MR1_mpr_anon_fslswapdim_bet.nii.gz'
, '/home/runner/nilearn_data/oasis1/OAS1_0007_MR1/mwrc1OAS1_0007_MR1_mpr_anon_fs
lswapdim_bet.nii.gz', '/home/runner/nilearn_data/oasis1/OAS1_0076_MR1/mwrc1OAS1_
0076_MR1_mpr_anon_fslswapdim_bet.nii.gz', '/home/runner/nilearn_data/oasis1/OAS1
_0095_MR1/mwrc1OAS1_0095_MR1_mpr_anon_fslswapdim_bet.nii.gz', '/home/runner/nile
arn_data/oasis1/OAS1_0136_MR1/mwrc1OAS1_0136_MR1_mpr_anon_fslswapdim_bet.nii.gz'
, '/home/runner/nilearn_data/oasis1/OAS1_0176_MR1/mwrc1OAS1_0176_MR1_mpr_anon_fs
lswapdim_bet.nii.gz', '/home/runner/nilearn_data/oasis1/OAS1_0193_MR1/mwrc1OAS1_
0193_MR1_mpr_anon_fslswapdim_bet.nii.gz', '/home/runner/nilearn_data/oasis1/OAS1
_0177_MR1/mwrc1OAS1_0177_MR1_mpr_anon_fslswapdim_bet.nii.gz', '/home/runner/nile
arn_data/oasis1/OAS1_0103_MR1/mwrc1OAS1_0103_MR1_mpr_anon_fslswapdim_bet.nii.gz'
, '/home/runner/nilearn_data/oasis1/OAS1_0227_MR1/mwrc1OAS1_0227_MR1_mpr_anon_fs
lswapdim_bet.nii.gz', '/home/runner/nilearn_data/oasis1/OAS1_0013_MR1/mwrc1OAS1_
0013_MR1_mpr_anon_fslswapdim_bet.nii.gz', '/home/runner/nilearn_data/oasis1/OAS1
_0134_MR1/mwrc1OAS1_0134_MR1_mpr_anon_fslswapdim_bet.nii.gz', '/home/runner/nile
arn_data/oasis1/OAS1_0114_MR1/mwrc1OAS1_0114_MR1_mpr_anon_fslswapdim_bet.nii.gz'
, '/home/runner/nilearn_data/oasis1/OAS1_0040_MR1/mwrc1OAS1_0040_MR1_mpr_anon_fs
lswapdim_bet.nii.gz', '/home/runner/nilearn_data/oasis1/OAS1_0064_MR1/mwrc1OAS1_
0064_MR1_mpr_anon_fslswapdim_bet.nii.gz', '/home/runner/nilearn_data/oasis1/OAS1
_0073_MR1/mwrc1OAS1_0073_MR1_mpr_anon_fslswapdim_bet.nii.gz', '/home/runner/nile
arn_data/oasis1/OAS1_0002_MR1/mwrc1OAS1_0002_MR1_mpr_anon_fslswapdim_bet.nii.gz'
, '/home/runner/nilearn_data/oasis1/OAS1_0135_MR1/mwrc1OAS1_0135_MR1_mpr_anon_fs
lswapdim_bet.nii.gz', '/home/runner/nilearn_data/oasis1/OAS1_0183_MR1/mwrc1OAS1_
0183_MR1_mpr_anon_fslswapdim_bet.nii.gz', '/home/runner/nilearn_data/oasis1/OAS1
_0047_MR1/mwrc1OAS1_0047_MR1_mpr_anon_fslswapdim_bet.nii.gz', '/home/runner/nile
arn_data/oasis1/OAS1_0117_MR1/mwrc1OAS1_0117_MR1_mpr_anon_fslswapdim_bet.nii.gz'
, '/home/runner/nilearn_data/oasis1/OAS1_0147_MR1/mwrc1OAS1_0147_MR1_mpr_anon_fs
lswapdim_bet.nii.gz', '/home/runner/nilearn_data/oasis1/OAS1_0197_MR1/mwrc1OAS1_
0197_MR1_mpr_anon_fslswapdim_bet.nii.gz', '/home/runner/nilearn_data/oasis1/OAS1
_0019_MR1/mwrc1OAS1_0019_MR1_mpr_anon_fslswapdim_bet.nii.gz', '/home/runner/nile
arn_data/oasis1/OAS1_0043_MR1/mwrc1OAS1_0043_MR1_mpr_anon_fslswapdim_bet.nii.gz'
, '/home/runner/nilearn_data/oasis1/OAS1_0148_MR1/mwrc1OAS1_0148_MR1_mpr_anon_fs
lswapdim_bet.nii.gz', '/home/runner/nilearn_data/oasis1/OAS1_0060_MR1/mwrc1OAS1_
0060_MR1_mpr_anon_fslswapdim_bet.nii.gz', '/home/runner/nilearn_data/oasis1/OAS1
_0178_MR1/mwrc1OAS1_0178_MR1_mpr_anon_fslswapdim_bet.nii.gz', '/home/runner/nile
arn_data/oasis1/OAS1_0143_MR1/mwrc1OAS1_0143_MR1_mpr_anon_fslswapdim_bet.nii.gz'
, '/home/runner/nilearn_data/oasis1/OAS1_0039_MR1/mwrc1OAS1_0039_MR1_mpr_anon_fs
lswapdim_bet.nii.gz', '/home/runner/nilearn_data/oasis1/OAS1_0032_MR1/mwrc1OAS1_
0032_MR1_mpr_anon_fslswapdim_bet.nii.gz', '/home/runner/nilearn_data/oasis1/OAS1
_0129_MR1/mwrc1OAS1_0129_MR1_mpr_anon_fslswapdim_bet.nii.gz', '/home/runner/nile
arn_data/oasis1/OAS1_0169_MR1/mwrc1OAS1_0169_MR1_mpr_anon_fslswapdim_bet.nii.gz'
, '/home/runner/nilearn_data/oasis1/OAS1_0035_MR1/mwrc1OAS1_0035_MR1_mpr_anon_fs
lswapdim_bet.nii.gz', '/home/runner/nilearn_data/oasis1/OAS1_0188_MR1/mwrc1OAS1_
0188_MR1_mpr_anon_fslswapdim_bet.nii.gz', '/home/runner/nilearn_data/oasis1/OAS1
_0142_MR1/mwrc1OAS1_0142_MR1_mpr_anon_fslswapdim_bet.nii.gz', '/home/runner/nile
arn_data/oasis1/OAS1_0200_MR1/mwrc1OAS1_0200_MR1_mpr_anon_fslswapdim_bet.nii.gz'
, '/home/runner/nilearn_data/oasis1/OAS1_0037_MR1/mwrc1OAS1_0037_MR1_mpr_anon_fs
lswapdim_bet.nii.gz', '/home/runner/nilearn_data/oasis1/OAS1_0160_MR1/mwrc1OAS1_
0160_MR1_mpr_anon_fslswapdim_bet.nii.gz', '/home/runner/nilearn_data/oasis1/OAS1
_0191_MR1/mwrc1OAS1_0191_MR1_mpr_anon_fslswapdim_bet.nii.gz', '/home/runner/nile
arn_data/oasis1/OAS1_0165_MR1/mwrc1OAS1_0165_MR1_mpr_anon_fslswapdim_bet.nii.gz'
, '/home/runner/nilearn_data/oasis1/OAS1_0033_MR1/mwrc1OAS1_0033_MR1_mpr_anon_fs
lswapdim_bet.nii.gz', '/home/runner/nilearn_data/oasis1/OAS1_0111_MR1/mwrc1OAS1_
0111_MR1_mpr_anon_fslswapdim_bet.nii.gz', '/home/runner/nilearn_data/oasis1/OAS1
_0092_MR1/mwrc1OAS1_0092_MR1_mpr_anon_fslswapdim_bet.nii.gz', '/home/runner/nile
arn_data/oasis1/OAS1_0088_MR1/mwrc1OAS1_0088_MR1_mpr_anon_fslswapdim_bet.nii.gz'
, '/home/runner/nilearn_data/oasis1/OAS1_0130_MR1/mwrc1OAS1_0130_MR1_mpr_anon_fs
lswapdim_bet.nii.gz', '/home/runner/nilearn_data/oasis1/OAS1_0166_MR1/mwrc1OAS1_
0166_MR1_mpr_anon_fslswapdim_bet.nii.gz', '/home/runner/nilearn_data/oasis1/OAS1
_0218_MR1/mwrc1OAS1_0218_MR1_mpr_anon_fslswapdim_bet.nii.gz', '/home/runner/nile
arn_data/oasis1/OAS1_0080_MR1/mwrc1OAS1_0080_MR1_mpr_anon_fslswapdim_bet.nii.gz'
, '/home/runner/nilearn_data/oasis1/OAS1_0086_MR1/mwrc1OAS1_0086_MR1_mpr_anon_fs
lswapdim_bet.nii.gz', '/home/runner/nilearn_data/oasis1/OAS1_0029_MR1/mwrc1OAS1_
0029_MR1_mpr_anon_fslswapdim_bet.nii.gz', '/home/runner/nilearn_data/oasis1/OAS1
_0186_MR1/mwrc1OAS1_0186_MR1_mpr_anon_fslswapdim_bet.nii.gz', '/home/runner/nile
arn_data/oasis1/OAS1_0091_MR1/mwrc1OAS1_0091_MR1_mpr_anon_fslswapdim_bet.nii.gz'
, '/home/runner/nilearn_data/oasis1/OAS1_0212_MR1/mwrc1OAS1_0212_MR1_mpr_anon_fs
lswapdim_bet.nii.gz', '/home/runner/nilearn_data/oasis1/OAS1_0198_MR1/mwrc1OAS1_
0198_MR1_mpr_anon_fslswapdim_bet.nii.gz', '/home/runner/nilearn_data/oasis1/OAS1
_0214_MR1/mwrc1OAS1_0214_MR1_mpr_anon_fslswapdim_bet.nii.gz', '/home/runner/nile
arn_data/oasis1/OAS1_0044_MR1/mwrc1OAS1_0044_MR1_mpr_anon_fslswapdim_bet.nii.gz'
, '/home/runner/nilearn_data/oasis1/OAS1_0065_MR1/mwrc1OAS1_0065_MR1_mpr_anon_fs
lswapdim_bet.nii.gz', '/home/runner/nilearn_data/oasis1/OAS1_0158_MR1/mwrc1OAS1_
0158_MR1_mpr_anon_fslswapdim_bet.nii.gz', '/home/runner/nilearn_data/oasis1/OAS1
_0099_MR1/mwrc1OAS1_0099_MR1_mpr_anon_fslswapdim_bet.nii.gz', '/home/runner/nile
arn_data/oasis1/OAS1_0078_MR1/mwrc1OAS1_0078_MR1_mpr_anon_fslswapdim_bet.nii.gz'
, '/home/runner/nilearn_data/oasis1/OAS1_0098_MR1/mwrc1OAS1_0098_MR1_mpr_anon_fs
lswapdim_bet.nii.gz', '/home/runner/nilearn_data/oasis1/OAS1_0041_MR1/mwrc1OAS1_
0041_MR1_mpr_anon_fslswapdim_bet.nii.gz', '/home/runner/nilearn_data/oasis1/OAS1
_0023_MR1/mwrc1OAS1_0023_MR1_mpr_anon_fslswapdim_bet.nii.gz', '/home/runner/nile
arn_data/oasis1/OAS1_0011_MR1/mwrc1OAS1_0011_MR1_mpr_anon_fslswapdim_bet.nii.gz'
, '/home/runner/nilearn_data/oasis1/OAS1_0115_MR1/mwrc1OAS1_0115_MR1_mpr_anon_fs
lswapdim_bet.nii.gz', '/home/runner/nilearn_data/oasis1/OAS1_0075_MR1/mwrc1OAS1_
0075_MR1_mpr_anon_fslswapdim_bet.nii.gz', '/home/runner/nilearn_data/oasis1/OAS1
_0217_MR1/mwrc1OAS1_0217_MR1_mpr_anon_fslswapdim_bet.nii.gz', '/home/runner/nile
arn_data/oasis1/OAS1_0132_MR1/mwrc1OAS1_0132_MR1_mpr_anon_fslswapdim_bet.nii.gz'
, '/home/runner/nilearn_data/oasis1/OAS1_0053_MR1/mwrc1OAS1_0053_MR1_mpr_anon_fs
lswapdim_bet.nii.gz', '/home/runner/nilearn_data/oasis1/OAS1_0195_MR1/mwrc1OAS1_
0195_MR1_mpr_anon_fslswapdim_bet.nii.gz']
\[NiftiMasker.wrapped] Computing mask
________________________________________________________________________________
[Memory] Calling nilearn.masking.compute_background_mask...
compute_background_mask([ '/home/runner/nilearn_data/oasis1/OAS1_0211_MR1/mwrc1OAS1_0211_MR1_mpr_anon_fslswapdim_bet.nii.gz',
  '/home/runner/nilearn_data/oasis1/OAS1_0052_MR1/mwrc1OAS1_0052_MR1_mpr_anon_fslswapdim_bet.nii.gz',
  '/home/runner/nilearn_data/oasis1/OAS1_0155_MR1/mwrc1OAS1_0155_MR1_mpr_anon_fslswapdim_bet.nii.gz',
  '/home/runner/nilearn_data/oasis1/OAS1_0221_MR1/mwrc1OAS1_0221_MR1_mpr_anon_fslswapdim_bet.nii.gz',
  '/home/runner/nilearn_data/oasis1/OAS1_0121_MR1/mwrc1OAS1_0121_MR1_mpr_anon_fslswapdim_bet.nii.gz',
  '/home/runner/nilearn_data/oasis1/OAS1_0070_MR1/mwrc1OAS1_0070_MR1_mpr_anon_fslswapdim_bet.nii.gz',
  '/home/runner/nilearn_data/oasis1/OAS1_0003_MR1/mwrc1OAS1_0003_MR1_mpr_anon_fslswapdim..., verbose=0)
__________________________________________compute_background_mask - 1.5s, 0.0min
\[NiftiMasker.wrapped] Resampling mask
________________________________________________________________________________
[Memory] Calling nilearn.image.resampling.resample_img...
resample_img(<nibabel.nifti1.Nifti1Image object at 0x7f0c034409d0>, target_affine=None, target_shape=None, copy=False, interpolation='nearest')
_____________________________________________________resample_img - 0.0s, 0.0min
\[NiftiMasker.wrapped] Finished fit
/home/runner/work/nilearn/nilearn/examples/02_decoding/plot_oasis_vbm.py:94: FutureWarning:

boolean values for 'standardize' will be deprecated in nilearn 0.15.0.
Use 'zscore_sample' instead of 'True' or use 'None' instead of 'False'.

________________________________________________________________________________
[Memory] Calling nilearn.maskers.nifti_masker.filter_and_mask...
filter_and_mask([ '/home/runner/nilearn_data/oasis1/OAS1_0211_MR1/mwrc1OAS1_0211_MR1_mpr_anon_fslswapdim_bet.nii.gz',
  '/home/runner/nilearn_data/oasis1/OAS1_0052_MR1/mwrc1OAS1_0052_MR1_mpr_anon_fslswapdim_bet.nii.gz',
  '/home/runner/nilearn_data/oasis1/OAS1_0155_MR1/mwrc1OAS1_0155_MR1_mpr_anon_fslswapdim_bet.nii.gz',
  '/home/runner/nilearn_data/oasis1/OAS1_0221_MR1/mwrc1OAS1_0221_MR1_mpr_anon_fslswapdim_bet.nii.gz',
  '/home/runner/nilearn_data/oasis1/OAS1_0121_MR1/mwrc1OAS1_0121_MR1_mpr_anon_fslswapdim_bet.nii.gz',
  '/home/runner/nilearn_data/oasis1/OAS1_0070_MR1/mwrc1OAS1_0070_MR1_mpr_anon_fslswapdim_bet.nii.gz',
  '/home/runner/nilearn_data/oasis1/OAS1_0003_MR1/mwrc1OAS1_0003_MR1_mpr_anon_fslswapdim...,
<nibabel.nifti1.Nifti1Image object at 0x7f0c034409d0>, { 'clean_args': None,
  'clean_kwargs': {},
  'cmap': 'gray',
  'detrend': False,
  'dtype': None,
  'high_pass': None,
  'high_variance_confounds': False,
  'low_pass': None,
  'reports': True,
  'runs': None,
  'smoothing_fwhm': 2,
  'standardize': False,
  'standardize_confounds': True,
  't_r': None,
  'target_affine': None,
  'target_shape': None}, memory_level=1, memory=Memory(location=nilearn_cache/joblib), verbose=1, confounds=None, sample_mask=None, copy=True, sklearn_output_config=None)
\[NiftiMasker.wrapped] Loading data from <nibabel.nifti1.Nifti1Image object at
0x7f0c034f3eb0>
\[NiftiMasker.wrapped] Smoothing images
\[NiftiMasker.wrapped] Extracting region signals
\[NiftiMasker.wrapped] Cleaning extracted signals
__________________________________________________filter_and_mask - 5.2s, 0.1min
/home/runner/work/nilearn/nilearn/examples/02_decoding/plot_oasis_vbm.py:101: UserWarning:

Casting boolean input to <class 'numpy.int32'>

\[NiftiMasker.inverse_transform] Computing image from signals
________________________________________________________________________________
[Memory] Calling nilearn.masking.unmask...
unmask(array([0, ..., 0], dtype=int32), <nibabel.nifti1.Nifti1Image object at 0x7f0c034409d0>)
___________________________________________________________unmask - 0.0s, 0.0min
Prediction pipeline with ANOVA and SVR using
DecoderRegressor Object
In nilearn we can benefit from the built-in DecoderRegressor object to
do ANOVA with SVR instead of manually defining the whole pipeline.
This estimator also uses Cross Validation to select best models and ensemble
them. Furthermore, you can pass n_jobs=<some_high_value> to the
DecoderRegressor class to take advantage of a multi-core system.
To save time (because these are anat images with many voxels), we include
only the 1-percent voxels most correlated with the age variable to fit. We
also want to set mask hyperparameter to be the mask we just obtained above.
from nilearn.decoding import DecoderRegressor

decoder = DecoderRegressor(
    estimator="svr",
    mask=mask,
    scoring="neg_mean_absolute_error",
    screening_percentile=1,
    n_jobs=2,
    verbose=1,
)
# Fit and predict with the decoder
decoder.fit(gm_imgs_train, age_train)

# Sort test data for better visualization (trend, etc.)
perm = np.argsort(age_test)[::-1]
age_test = age_test[perm]
gm_imgs_test = np.array(gm_imgs_test)[perm]
age_pred = decoder.predict(gm_imgs_test)

prediction_score = -np.mean(decoder.cv_scores_["beta"])

print("=== DECODER ===")
print(f"explained variance for the cross-validation: {prediction_score:f}")
print()
\[DecoderRegressor.fit] Mask volume = 1.21634e+06mm^3 = 1216.34cm^3
\[DecoderRegressor.fit] Standard brain volume = 1.88299e+06mm^3
\[DecoderRegressor.fit] Original screening-percentile: 1
\[DecoderRegressor.fit] Corrected screening-percentile: 1.54807
\[DecoderRegressor.fit] The decoding model will be trained on 1520 features.
\[DecoderRegressor.fit] The decoding model will be trained on 1520 features.
[Parallel(n_jobs=2)]: Using backend LokyBackend with 2 concurrent workers.
[Parallel(n_jobs=2)]: Done  10 out of  10 | elapsed:    2.3s finished
=== DECODER ===
explained variance for the cross-validation: 11.774939
Visualization
weight_img = decoder.coef_img_["beta"]

# Create the figure
from nilearn.plotting import plot_stat_map, show

bg_filename = gray_matter_map_filenames[0]
z_slice = 0
display = plot_stat_map(
    weight_img,
    bg_img=bg_filename,
    display_mode="z",
    cut_coords=[z_slice],
    title="SVM weights",
)
show()
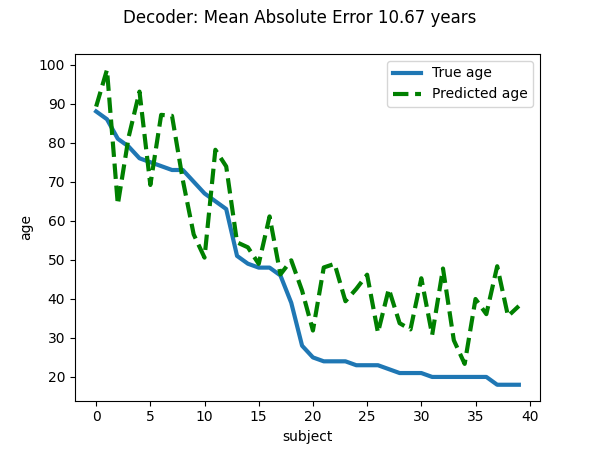
Visualize the quality of predictions
import matplotlib.pyplot as plt
plt.figure(figsize=(6, 4.5))
plt.suptitle(f"Decoder: Mean Absolute Error {prediction_score:.2f} years")
linewidth = 3
plt.plot(age_test, label="True age", linewidth=linewidth)
plt.plot(age_pred, "--", c="g", label="Predicted age", linewidth=linewidth)
plt.ylabel("age")
plt.xlabel("subject")
plt.legend(loc="best")
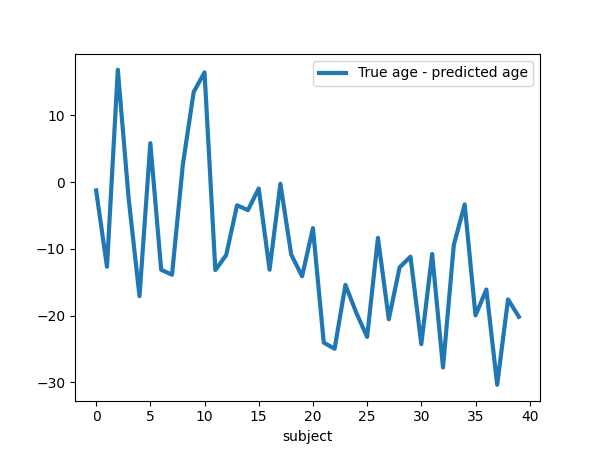
plt.figure(figsize=(6, 4.5))
plt.plot(
age_test - age_pred, label="True age - predicted age", linewidth=linewidth
)
plt.xlabel("subject")
plt.legend(loc="best")
<matplotlib.legend.Legend object at 0x7f0c034f0250>
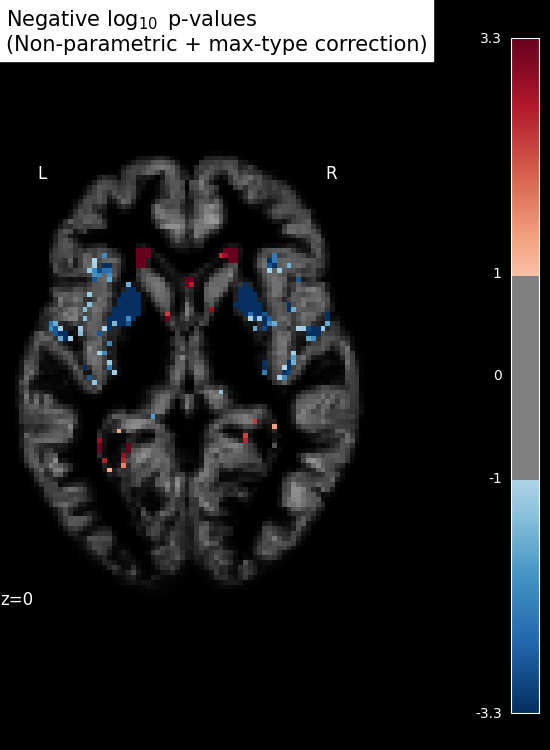
Inference with massively univariate model
print("Massively univariate model")

gm_maps_masked = NiftiMasker(verbose=1).fit_transform(
    gray_matter_map_filenames
)
data = variance_threshold.fit_transform(gm_maps_masked)

# Statistical inference
from nilearn.mass_univariate import permuted_ols

# This can be changed to use more CPUs.
output = permuted_ols(
    age,
    data,  # + intercept as a covariate by default
    n_perm=2000,  # 1,000 in the interest of time; 10000 would be better
    verbose=1,  # display progress bar
    n_jobs=2,
)
neg_log_pvals = output["logp_max_t"]
t_scores_original_data = output["t"]
signed_neg_log_pvals = neg_log_pvals * np.sign(t_scores_original_data)
signed_neg_log_pvals_unmasked = nifti_masker.inverse_transform(
    variance_threshold.inverse_transform(signed_neg_log_pvals)
)

# Show results
threshold = -np.log10(0.1)  # 10% corrected

n_detections = (get_data(signed_neg_log_pvals_unmasked) > threshold).sum()

title = (
    "Negative $\\log_{10}$ p-values\n(Non-parametric + max-type correction)"
    f"\n{int(n_detections)} detections"
)

plot_stat_map(
    signed_neg_log_pvals_unmasked,
    bg_img=bg_filename,
    threshold=threshold,
    display_mode="z",
    cut_coords=[z_slice],
    figure=plt.figure(figsize=(5.5, 7.5), facecolor="k"),
    title=title,
)

show()
Massively univariate model
\[NiftiMasker.wrapped] Loading data from ['/home/runner/nilearn_data/oasis1/OAS1
_0001_MR1/mwrc1OAS1_0001_MR1_mpr_anon_fslswapdim_bet.nii.gz', '/home/runner/nile
arn_data/oasis1/OAS1_0002_MR1/mwrc1OAS1_0002_MR1_mpr_anon_fslswapdim_bet.nii.gz'
, '/home/runner/nilearn_data/oasis1/OAS1_0003_MR1/mwrc1OAS1_0003_MR1_mpr_anon_fs
lswapdim_bet.nii.gz', '/home/runner/nilearn_data/oasis1/OAS1_0004_MR1/mwrc1OAS1_
0004_MR1_mpr_anon_fslswapdim_bet.nii.gz', '/home/runner/nilearn_data/oasis1/OAS1
_0005_MR1/mwrc1OAS1_0005_MR1_mpr_anon_fslswapdim_bet.nii.gz', '/home/runner/nile
arn_data/oasis1/OAS1_0006_MR1/mwrc1OAS1_0006_MR1_mpr_anon_fslswapdim_bet.nii.gz'
, '/home/runner/nilearn_data/oasis1/OAS1_0007_MR1/mwrc1OAS1_0007_MR1_mpr_anon_fs
lswapdim_bet.nii.gz', '/home/runner/nilearn_data/oasis1/OAS1_0009_MR1/mwrc1OAS1_
0009_MR1_mpr_anon_fslswapdim_bet.nii.gz', '/home/runner/nilearn_data/oasis1/OAS1
_0010_MR1/mwrc1OAS1_0010_MR1_mpr_anon_fslswapdim_bet.nii.gz', '/home/runner/nile
arn_data/oasis1/OAS1_0011_MR1/mwrc1OAS1_0011_MR1_mpr_anon_fslswapdim_bet.nii.gz'
, '/home/runner/nilearn_data/oasis1/OAS1_0012_MR1/mwrc1OAS1_0012_MR1_mpr_anon_fs
lswapdim_bet.nii.gz', '/home/runner/nilearn_data/oasis1/OAS1_0013_MR1/mwrc1OAS1_
0013_MR1_mpr_anon_fslswapdim_bet.nii.gz', '/home/runner/nilearn_data/oasis1/OAS1
_0014_MR1/mwrc1OAS1_0014_MR1_mpr_anon_fslswapdim_bet.nii.gz', '/home/runner/nile
arn_data/oasis1/OAS1_0015_MR1/mwrc1OAS1_0015_MR1_mpr_anon_fslswapdim_bet.nii.gz'
, '/home/runner/nilearn_data/oasis1/OAS1_0016_MR1/mwrc1OAS1_0016_MR1_mpr_anon_fs
lswapdim_bet.nii.gz', '/home/runner/nilearn_data/oasis1/OAS1_0017_MR1/mwrc1OAS1_
0017_MR1_mpr_anon_fslswapdim_bet.nii.gz', '/home/runner/nilearn_data/oasis1/OAS1
_0018_MR1/mwrc1OAS1_0018_MR1_mpr_anon_fslswapdim_bet.nii.gz', '/home/runner/nile
arn_data/oasis1/OAS1_0019_MR1/mwrc1OAS1_0019_MR1_mpr_anon_fslswapdim_bet.nii.gz'
, '/home/runner/nilearn_data/oasis1/OAS1_0020_MR1/mwrc1OAS1_0020_MR1_mpr_anon_fs
lswapdim_bet.nii.gz', '/home/runner/nilearn_data/oasis1/OAS1_0021_MR1/mwrc1OAS1_
0021_MR1_mpr_anon_fslswapdim_bet.nii.gz', '/home/runner/nilearn_data/oasis1/OAS1
_0022_MR1/mwrc1OAS1_0022_MR1_mpr_anon_fslswapdim_bet.nii.gz', '/home/runner/nile
arn_data/oasis1/OAS1_0023_MR1/mwrc1OAS1_0023_MR1_mpr_anon_fslswapdim_bet.nii.gz'
, '/home/runner/nilearn_data/oasis1/OAS1_0025_MR1/mwrc1OAS1_0025_MR1_mpr_anon_fs
lswapdim_bet.nii.gz', '/home/runner/nilearn_data/oasis1/OAS1_0026_MR1/mwrc1OAS1_
0026_MR1_mpr_anon_fslswapdim_bet.nii.gz', '/home/runner/nilearn_data/oasis1/OAS1
_0028_MR1/mwrc1OAS1_0028_MR1_mpr_anon_fslswapdim_bet.nii.gz', '/home/runner/nile
arn_data/oasis1/OAS1_0029_MR1/mwrc1OAS1_0029_MR1_mpr_anon_fslswapdim_bet.nii.gz'
, '/home/runner/nilearn_data/oasis1/OAS1_0030_MR1/mwrc1OAS1_0030_MR1_mpr_anon_fs
lswapdim_bet.nii.gz', '/home/runner/nilearn_data/oasis1/OAS1_0031_MR1/mwrc1OAS1_
0031_MR1_mpr_anon_fslswapdim_bet.nii.gz', '/home/runner/nilearn_data/oasis1/OAS1
_0032_MR1/mwrc1OAS1_0032_MR1_mpr_anon_fslswapdim_bet.nii.gz', '/home/runner/nile
arn_data/oasis1/OAS1_0033_MR1/mwrc1OAS1_0033_MR1_mpr_anon_fslswapdim_bet.nii.gz'
, '/home/runner/nilearn_data/oasis1/OAS1_0034_MR1/mwrc1OAS1_0034_MR1_mpr_anon_fs
lswapdim_bet.nii.gz', '/home/runner/nilearn_data/oasis1/OAS1_0035_MR1/mwrc1OAS1_
0035_MR1_mpr_anon_fslswapdim_bet.nii.gz', '/home/runner/nilearn_data/oasis1/OAS1
_0037_MR1/mwrc1OAS1_0037_MR1_mpr_anon_fslswapdim_bet.nii.gz', '/home/runner/nile
arn_data/oasis1/OAS1_0038_MR1/mwrc1OAS1_0038_MR1_mpr_anon_fslswapdim_bet.nii.gz'
, '/home/runner/nilearn_data/oasis1/OAS1_0039_MR1/mwrc1OAS1_0039_MR1_mpr_anon_fs
lswapdim_bet.nii.gz', '/home/runner/nilearn_data/oasis1/OAS1_0040_MR1/mwrc1OAS1_
0040_MR1_mpr_anon_fslswapdim_bet.nii.gz', '/home/runner/nilearn_data/oasis1/OAS1
_0041_MR1/mwrc1OAS1_0041_MR1_mpr_anon_fslswapdim_bet.nii.gz', '/home/runner/nile
arn_data/oasis1/OAS1_0042_MR1/mwrc1OAS1_0042_MR1_mpr_anon_fslswapdim_bet.nii.gz'
, '/home/runner/nilearn_data/oasis1/OAS1_0043_MR1/mwrc1OAS1_0043_MR1_mpr_anon_fs
lswapdim_bet.nii.gz', '/home/runner/nilearn_data/oasis1/OAS1_0044_MR1/mwrc1OAS1_
0044_MR1_mpr_anon_fslswapdim_bet.nii.gz', '/home/runner/nilearn_data/oasis1/OAS1
_0045_MR1/mwrc1OAS1_0045_MR1_mpr_anon_fslswapdim_bet.nii.gz', '/home/runner/nile
arn_data/oasis1/OAS1_0046_MR1/mwrc1OAS1_0046_MR1_mpr_anon_fslswapdim_bet.nii.gz'
, '/home/runner/nilearn_data/oasis1/OAS1_0047_MR1/mwrc1OAS1_0047_MR1_mpr_anon_fs
lswapdim_bet.nii.gz', '/home/runner/nilearn_data/oasis1/OAS1_0049_MR1/mwrc1OAS1_
0049_MR1_mpr_anon_fslswapdim_bet.nii.gz', '/home/runner/nilearn_data/oasis1/OAS1
_0050_MR1/mwrc1OAS1_0050_MR1_mpr_anon_fslswapdim_bet.nii.gz', '/home/runner/nile
arn_data/oasis1/OAS1_0051_MR1/mwrc1OAS1_0051_MR1_mpr_anon_fslswapdim_bet.nii.gz'
, '/home/runner/nilearn_data/oasis1/OAS1_0052_MR1/mwrc1OAS1_0052_MR1_mpr_anon_fs
lswapdim_bet.nii.gz', '/home/runner/nilearn_data/oasis1/OAS1_0053_MR1/mwrc1OAS1_
0053_MR1_mpr_anon_fslswapdim_bet.nii.gz', '/home/runner/nilearn_data/oasis1/OAS1
_0054_MR1/mwrc1OAS1_0054_MR1_mpr_anon_fslswapdim_bet.nii.gz', '/home/runner/nile
arn_data/oasis1/OAS1_0055_MR1/mwrc1OAS1_0055_MR1_mpr_anon_fslswapdim_bet.nii.gz'
, '/home/runner/nilearn_data/oasis1/OAS1_0056_MR1/mwrc1OAS1_0056_MR1_mpr_anon_fs
lswapdim_bet.nii.gz', '/home/runner/nilearn_data/oasis1/OAS1_0058_MR1/mwrc1OAS1_
0058_MR1_mpr_anon_fslswapdim_bet.nii.gz', '/home/runner/nilearn_data/oasis1/OAS1
_0059_MR1/mwrc1OAS1_0059_MR1_mpr_anon_fslswapdim_bet.nii.gz', '/home/runner/nile
arn_data/oasis1/OAS1_0060_MR1/mwrc1OAS1_0060_MR1_mpr_anon_fslswapdim_bet.nii.gz'
, '/home/runner/nilearn_data/oasis1/OAS1_0061_MR1/mwrc1OAS1_0061_MR1_mpr_anon_fs
lswapdim_bet.nii.gz', '/home/runner/nilearn_data/oasis1/OAS1_0062_MR1/mwrc1OAS1_
0062_MR1_mpr_anon_fslswapdim_bet.nii.gz', '/home/runner/nilearn_data/oasis1/OAS1
_0063_MR1/mwrc1OAS1_0063_MR1_mpr_anon_fslswapdim_bet.nii.gz', '/home/runner/nile
arn_data/oasis1/OAS1_0064_MR1/mwrc1OAS1_0064_MR1_mpr_anon_fslswapdim_bet.nii.gz'
, '/home/runner/nilearn_data/oasis1/OAS1_0065_MR1/mwrc1OAS1_0065_MR1_mpr_anon_fs
lswapdim_bet.nii.gz', '/home/runner/nilearn_data/oasis1/OAS1_0067_MR1/mwrc1OAS1_
0067_MR1_mpr_anon_fslswapdim_bet.nii.gz', '/home/runner/nilearn_data/oasis1/OAS1
_0068_MR1/mwrc1OAS1_0068_MR1_mpr_anon_fslswapdim_bet.nii.gz', '/home/runner/nile
arn_data/oasis1/OAS1_0069_MR1/mwrc1OAS1_0069_MR1_mpr_anon_fslswapdim_bet.nii.gz'
, '/home/runner/nilearn_data/oasis1/OAS1_0070_MR1/mwrc1OAS1_0070_MR1_mpr_anon_fs
lswapdim_bet.nii.gz', '/home/runner/nilearn_data/oasis1/OAS1_0071_MR1/mwrc1OAS1_
0071_MR1_mpr_anon_fslswapdim_bet.nii.gz', '/home/runner/nilearn_data/oasis1/OAS1
_0072_MR1/mwrc1OAS1_0072_MR1_mpr_anon_fslswapdim_bet.nii.gz', '/home/runner/nile
arn_data/oasis1/OAS1_0073_MR1/mwrc1OAS1_0073_MR1_mpr_anon_fslswapdim_bet.nii.gz'
, '/home/runner/nilearn_data/oasis1/OAS1_0074_MR1/mwrc1OAS1_0074_MR1_mpr_anon_fs
lswapdim_bet.nii.gz', '/home/runner/nilearn_data/oasis1/OAS1_0075_MR1/mwrc1OAS1_
0075_MR1_mpr_anon_fslswapdim_bet.nii.gz', '/home/runner/nilearn_data/oasis1/OAS1
_0076_MR1/mwrc1OAS1_0076_MR1_mpr_anon_fslswapdim_bet.nii.gz', '/home/runner/nile
arn_data/oasis1/OAS1_0077_MR1/mwrc1OAS1_0077_MR1_mpr_anon_fslswapdim_bet.nii.gz'
, '/home/runner/nilearn_data/oasis1/OAS1_0078_MR1/mwrc1OAS1_0078_MR1_mpr_anon_fs
lswapdim_bet.nii.gz', '/home/runner/nilearn_data/oasis1/OAS1_0079_MR1/mwrc1OAS1_
0079_MR1_mpr_anon_fslswapdim_bet.nii.gz', '/home/runner/nilearn_data/oasis1/OAS1
_0080_MR1/mwrc1OAS1_0080_MR1_mpr_anon_fslswapdim_bet.nii.gz', '/home/runner/nile
arn_data/oasis1/OAS1_0081_MR1/mwrc1OAS1_0081_MR1_mpr_anon_fslswapdim_bet.nii.gz'
, '/home/runner/nilearn_data/oasis1/OAS1_0082_MR1/mwrc1OAS1_0082_MR1_mpr_anon_fs
lswapdim_bet.nii.gz', '/home/runner/nilearn_data/oasis1/OAS1_0084_MR1/mwrc1OAS1_
0084_MR1_mpr_anon_fslswapdim_bet.nii.gz', '/home/runner/nilearn_data/oasis1/OAS1
_0085_MR1/mwrc1OAS1_0085_MR1_mpr_anon_fslswapdim_bet.nii.gz', '/home/runner/nile
arn_data/oasis1/OAS1_0086_MR1/mwrc1OAS1_0086_MR1_mpr_anon_fslswapdim_bet.nii.gz'
, '/home/runner/nilearn_data/oasis1/OAS1_0087_MR1/mwrc1OAS1_0087_MR1_mpr_anon_fs
lswapdim_bet.nii.gz', '/home/runner/nilearn_data/oasis1/OAS1_0088_MR1/mwrc1OAS1_
0088_MR1_mpr_anon_fslswapdim_bet.nii.gz', '/home/runner/nilearn_data/oasis1/OAS1
_0090_MR1/mwrc1OAS1_0090_MR1_mpr_anon_fslswapdim_bet.nii.gz', '/home/runner/nile
arn_data/oasis1/OAS1_0091_MR1/mwrc1OAS1_0091_MR1_mpr_anon_fslswapdim_bet.nii.gz'
, '/home/runner/nilearn_data/oasis1/OAS1_0092_MR1/mwrc1OAS1_0092_MR1_mpr_anon_fs
lswapdim_bet.nii.gz', '/home/runner/nilearn_data/oasis1/OAS1_0094_MR1/mwrc1OAS1_
0094_MR1_mpr_anon_fslswapdim_bet.nii.gz', '/home/runner/nilearn_data/oasis1/OAS1
_0095_MR1/mwrc1OAS1_0095_MR1_mpr_anon_fslswapdim_bet.nii.gz', '/home/runner/nile
arn_data/oasis1/OAS1_0096_MR1/mwrc1OAS1_0096_MR1_mpr_anon_fslswapdim_bet.nii.gz'
, '/home/runner/nilearn_data/oasis1/OAS1_0097_MR1/mwrc1OAS1_0097_MR1_mpr_anon_fs
lswapdim_bet.nii.gz', '/home/runner/nilearn_data/oasis1/OAS1_0098_MR1/mwrc1OAS1_
0098_MR1_mpr_anon_fslswapdim_bet.nii.gz', '/home/runner/nilearn_data/oasis1/OAS1
_0099_MR1/mwrc1OAS1_0099_MR1_mpr_anon_fslswapdim_bet.nii.gz', '/home/runner/nile
arn_data/oasis1/OAS1_0101_MR1/mwrc1OAS1_0101_MR1_mpr_anon_fslswapdim_bet.nii.gz'
, '/home/runner/nilearn_data/oasis1/OAS1_0102_MR1/mwrc1OAS1_0102_MR1_mpr_anon_fs
lswapdim_bet.nii.gz', '/home/runner/nilearn_data/oasis1/OAS1_0103_MR1/mwrc1OAS1_
0103_MR1_mpr_anon_fslswapdim_bet.nii.gz', '/home/runner/nilearn_data/oasis1/OAS1
_0104_MR1/mwrc1OAS1_0104_MR1_mpr_anon_fslswapdim_bet.nii.gz', '/home/runner/nile
arn_data/oasis1/OAS1_0105_MR1/mwrc1OAS1_0105_MR1_mpr_anon_fslswapdim_bet.nii.gz'
, '/home/runner/nilearn_data/oasis1/OAS1_0106_MR1/mwrc1OAS1_0106_MR1_mpr_anon_fs
lswapdim_bet.nii.gz', '/home/runner/nilearn_data/oasis1/OAS1_0107_MR1/mwrc1OAS1_
0107_MR1_mpr_anon_fslswapdim_bet.nii.gz', '/home/runner/nilearn_data/oasis1/OAS1
_0108_MR1/mwrc1OAS1_0108_MR1_mpr_anon_fslswapdim_bet.nii.gz', '/home/runner/nile
arn_data/oasis1/OAS1_0109_MR1/mwrc1OAS1_0109_MR1_mpr_anon_fslswapdim_bet.nii.gz'
, '/home/runner/nilearn_data/oasis1/OAS1_0110_MR1/mwrc1OAS1_0110_MR1_mpr_anon_fs
lswapdim_bet.nii.gz', '/home/runner/nilearn_data/oasis1/OAS1_0111_MR1/mwrc1OAS1_
0111_MR1_mpr_anon_fslswapdim_bet.nii.gz', '/home/runner/nilearn_data/oasis1/OAS1
_0112_MR1/mwrc1OAS1_0112_MR1_mpr_anon_fslswapdim_bet.nii.gz', '/home/runner/nile
arn_data/oasis1/OAS1_0113_MR1/mwrc1OAS1_0113_MR1_mpr_anon_fslswapdim_bet.nii.gz'
, '/home/runner/nilearn_data/oasis1/OAS1_0114_MR1/mwrc1OAS1_0114_MR1_mpr_anon_fs
lswapdim_bet.nii.gz', '/home/runner/nilearn_data/oasis1/OAS1_0115_MR1/mwrc1OAS1_
0115_MR1_mpr_anon_fslswapdim_bet.nii.gz', '/home/runner/nilearn_data/oasis1/OAS1
_0116_MR1/mwrc1OAS1_0116_MR1_mpr_anon_fslswapdim_bet.nii.gz', '/home/runner/nile
arn_data/oasis1/OAS1_0117_MR1/mwrc1OAS1_0117_MR1_mpr_anon_fslswapdim_bet.nii.gz'
, '/home/runner/nilearn_data/oasis1/OAS1_0119_MR1/mwrc1OAS1_0119_MR1_mpr_anon_fs
lswapdim_bet.nii.gz', '/home/runner/nilearn_data/oasis1/OAS1_0120_MR1/mwrc1OAS1_
0120_MR1_mpr_anon_fslswapdim_bet.nii.gz', '/home/runner/nilearn_data/oasis1/OAS1
_0121_MR1/mwrc1OAS1_0121_MR1_mpr_anon_fslswapdim_bet.nii.gz', '/home/runner/nile
arn_data/oasis1/OAS1_0123_MR1/mwrc1OAS1_0123_MR1_mpr_anon_fslswapdim_bet.nii.gz'
, '/home/runner/nilearn_data/oasis1/OAS1_0124_MR1/mwrc1OAS1_0124_MR1_mpr_anon_fs
lswapdim_bet.nii.gz', '/home/runner/nilearn_data/oasis1/OAS1_0125_MR1/mwrc1OAS1_
0125_MR1_mpr_anon_fslswapdim_bet.nii.gz', '/home/runner/nilearn_data/oasis1/OAS1
_0126_MR1/mwrc1OAS1_0126_MR1_mpr_anon_fslswapdim_bet.nii.gz', '/home/runner/nile
arn_data/oasis1/OAS1_0127_MR1/mwrc1OAS1_0127_MR1_mpr_anon_fslswapdim_bet.nii.gz'
, '/home/runner/nilearn_data/oasis1/OAS1_0129_MR1/mwrc1OAS1_0129_MR1_mpr_anon_fs
lswapdim_bet.nii.gz', '/home/runner/nilearn_data/oasis1/OAS1_0130_MR1/mwrc1OAS1_
0130_MR1_mpr_anon_fslswapdim_bet.nii.gz', '/home/runner/nilearn_data/oasis1/OAS1
_0131_MR1/mwrc1OAS1_0131_MR1_mpr_anon_fslswapdim_bet.nii.gz', '/home/runner/nile
arn_data/oasis1/OAS1_0132_MR1/mwrc1OAS1_0132_MR1_mpr_anon_fslswapdim_bet.nii.gz'
, '/home/runner/nilearn_data/oasis1/OAS1_0133_MR1/mwrc1OAS1_0133_MR1_mpr_anon_fs
lswapdim_bet.nii.gz', '/home/runner/nilearn_data/oasis1/OAS1_0134_MR1/mwrc1OAS1_
0134_MR1_mpr_anon_fslswapdim_bet.nii.gz', '/home/runner/nilearn_data/oasis1/OAS1
_0135_MR1/mwrc1OAS1_0135_MR1_mpr_anon_fslswapdim_bet.nii.gz', '/home/runner/nile
arn_data/oasis1/OAS1_0136_MR1/mwrc1OAS1_0136_MR1_mpr_anon_fslswapdim_bet.nii.gz'
, '/home/runner/nilearn_data/oasis1/OAS1_0137_MR1/mwrc1OAS1_0137_MR1_mpr_anon_fs
lswapdim_bet.nii.gz', '/home/runner/nilearn_data/oasis1/OAS1_0138_MR1/mwrc1OAS1_
0138_MR1_mpr_anon_fslswapdim_bet.nii.gz', '/home/runner/nilearn_data/oasis1/OAS1
_0139_MR1/mwrc1OAS1_0139_MR1_mpr_anon_fslswapdim_bet.nii.gz', '/home/runner/nile
arn_data/oasis1/OAS1_0140_MR1/mwrc1OAS1_0140_MR1_mpr_anon_fslswapdim_bet.nii.gz'
, '/home/runner/nilearn_data/oasis1/OAS1_0141_MR1/mwrc1OAS1_0141_MR1_mpr_anon_fs
lswapdim_bet.nii.gz', '/home/runner/nilearn_data/oasis1/OAS1_0142_MR1/mwrc1OAS1_
0142_MR1_mpr_anon_fslswapdim_bet.nii.gz', '/home/runner/nilearn_data/oasis1/OAS1
_0143_MR1/mwrc1OAS1_0143_MR1_mpr_anon_fslswapdim_bet.nii.gz', '/home/runner/nile
arn_data/oasis1/OAS1_0144_MR1/mwrc1OAS1_0144_MR1_mpr_anon_fslswapdim_bet.nii.gz'
, '/home/runner/nilearn_data/oasis1/OAS1_0145_MR1/mwrc1OAS1_0145_MR1_mpr_anon_fs
lswapdim_bet.nii.gz', '/home/runner/nilearn_data/oasis1/OAS1_0146_MR1/mwrc1OAS1_
0146_MR1_mpr_anon_fslswapdim_bet.nii.gz', '/home/runner/nilearn_data/oasis1/OAS1
_0147_MR1/mwrc1OAS1_0147_MR1_mpr_anon_fslswapdim_bet.nii.gz', '/home/runner/nile
arn_data/oasis1/OAS1_0148_MR1/mwrc1OAS1_0148_MR1_mpr_anon_fslswapdim_bet.nii.gz'
, '/home/runner/nilearn_data/oasis1/OAS1_0150_MR1/mwrc1OAS1_0150_MR1_mpr_anon_fs
lswapdim_bet.nii.gz', '/home/runner/nilearn_data/oasis1/OAS1_0151_MR1/mwrc1OAS1_
0151_MR1_mpr_anon_fslswapdim_bet.nii.gz', '/home/runner/nilearn_data/oasis1/OAS1
_0152_MR1/mwrc1OAS1_0152_MR1_mpr_anon_fslswapdim_bet.nii.gz', '/home/runner/nile
arn_data/oasis1/OAS1_0153_MR1/mwrc1OAS1_0153_MR1_mpr_anon_fslswapdim_bet.nii.gz'
, '/home/runner/nilearn_data/oasis1/OAS1_0155_MR1/mwrc1OAS1_0155_MR1_mpr_anon_fs
lswapdim_bet.nii.gz', '/home/runner/nilearn_data/oasis1/OAS1_0156_MR1/mwrc1OAS1_
0156_MR1_mpr_anon_fslswapdim_bet.nii.gz', '/home/runner/nilearn_data/oasis1/OAS1
_0158_MR1/mwrc1OAS1_0158_MR1_mpr_anon_fslswapdim_bet.nii.gz', '/home/runner/nile
arn_data/oasis1/OAS1_0159_MR1/mwrc1OAS1_0159_MR1_mpr_anon_fslswapdim_bet.nii.gz'
, '/home/runner/nilearn_data/oasis1/OAS1_0160_MR1/mwrc1OAS1_0160_MR1_mpr_anon_fs
lswapdim_bet.nii.gz', '/home/runner/nilearn_data/oasis1/OAS1_0161_MR1/mwrc1OAS1_
0161_MR1_mpr_anon_fslswapdim_bet.nii.gz', '/home/runner/nilearn_data/oasis1/OAS1
_0162_MR1/mwrc1OAS1_0162_MR1_mpr_anon_fslswapdim_bet.nii.gz', '/home/runner/nile
arn_data/oasis1/OAS1_0163_MR1/mwrc1OAS1_0163_MR1_mpr_anon_fslswapdim_bet.nii.gz'
, '/home/runner/nilearn_data/oasis1/OAS1_0164_MR1/mwrc1OAS1_0164_MR1_mpr_anon_fs
lswapdim_bet.nii.gz', '/home/runner/nilearn_data/oasis1/OAS1_0165_MR1/mwrc1OAS1_
0165_MR1_mpr_anon_fslswapdim_bet.nii.gz', '/home/runner/nilearn_data/oasis1/OAS1
_0166_MR1/mwrc1OAS1_0166_MR1_mpr_anon_fslswapdim_bet.nii.gz', '/home/runner/nile
arn_data/oasis1/OAS1_0167_MR1/mwrc1OAS1_0167_MR1_mpr_anon_fslswapdim_bet.nii.gz'
, '/home/runner/nilearn_data/oasis1/OAS1_0168_MR1/mwrc1OAS1_0168_MR1_mpr_anon_fs
lswapdim_bet.nii.gz', '/home/runner/nilearn_data/oasis1/OAS1_0169_MR1/mwrc1OAS1_
0169_MR1_mpr_anon_fslswapdim_bet.nii.gz', '/home/runner/nilearn_data/oasis1/OAS1
_0170_MR1/mwrc1OAS1_0170_MR1_mpr_anon_fslswapdim_bet.nii.gz', '/home/runner/nile
arn_data/oasis1/OAS1_0173_MR1/mwrc1OAS1_0173_MR1_mpr_anon_fslswapdim_bet.nii.gz'
, '/home/runner/nilearn_data/oasis1/OAS1_0174_MR1/mwrc1OAS1_0174_MR1_mpr_anon_fs
lswapdim_bet.nii.gz', '/home/runner/nilearn_data/oasis1/OAS1_0176_MR1/mwrc1OAS1_
0176_MR1_mpr_anon_fslswapdim_bet.nii.gz', '/home/runner/nilearn_data/oasis1/OAS1
_0177_MR1/mwrc1OAS1_0177_MR1_mpr_anon_fslswapdim_bet.nii.gz', '/home/runner/nile
arn_data/oasis1/OAS1_0178_MR1/mwrc1OAS1_0178_MR1_mpr_anon_fslswapdim_bet.nii.gz'
, '/home/runner/nilearn_data/oasis1/OAS1_0179_MR1/mwrc1OAS1_0179_MR1_mpr_anon_fs
lswapdim_bet.nii.gz', '/home/runner/nilearn_data/oasis1/OAS1_0180_MR1/mwrc1OAS1_
0180_MR1_mpr_anon_fslswapdim_bet.nii.gz', '/home/runner/nilearn_data/oasis1/OAS1
_0181_MR1/mwrc1OAS1_0181_MR1_mpr_anon_fslswapdim_bet.nii.gz', '/home/runner/nile
arn_data/oasis1/OAS1_0182_MR1/mwrc1OAS1_0182_MR1_mpr_anon_fslswapdim_bet.nii.gz'
, '/home/runner/nilearn_data/oasis1/OAS1_0183_MR1/mwrc1OAS1_0183_MR1_mpr_anon_fs
lswapdim_bet.nii.gz', '/home/runner/nilearn_data/oasis1/OAS1_0184_MR1/mwrc1OAS1_
0184_MR1_mpr_anon_fslswapdim_bet.nii.gz', '/home/runner/nilearn_data/oasis1/OAS1
_0185_MR1/mwrc1OAS1_0185_MR1_mpr_anon_fslswapdim_bet.nii.gz', '/home/runner/nile
arn_data/oasis1/OAS1_0186_MR1/mwrc1OAS1_0186_MR1_mpr_anon_fslswapdim_bet.nii.gz'
, '/home/runner/nilearn_data/oasis1/OAS1_0188_MR1/mwrc1OAS1_0188_MR1_mpr_anon_fs
lswapdim_bet.nii.gz', '/home/runner/nilearn_data/oasis1/OAS1_0189_MR1/mwrc1OAS1_
0189_MR1_mpr_anon_fslswapdim_bet.nii.gz', '/home/runner/nilearn_data/oasis1/OAS1
_0190_MR1/mwrc1OAS1_0190_MR1_mpr_anon_fslswapdim_bet.nii.gz', '/home/runner/nile
arn_data/oasis1/OAS1_0191_MR1/mwrc1OAS1_0191_MR1_mpr_anon_fslswapdim_bet.nii.gz'
, '/home/runner/nilearn_data/oasis1/OAS1_0192_MR1/mwrc1OAS1_0192_MR1_mpr_anon_fs
lswapdim_bet.nii.gz', '/home/runner/nilearn_data/oasis1/OAS1_0193_MR1/mwrc1OAS1_
0193_MR1_mpr_anon_fslswapdim_bet.nii.gz', '/home/runner/nilearn_data/oasis1/OAS1
_0195_MR1/mwrc1OAS1_0195_MR1_mpr_anon_fslswapdim_bet.nii.gz', '/home/runner/nile
arn_data/oasis1/OAS1_0197_MR1/mwrc1OAS1_0197_MR1_mpr_anon_fslswapdim_bet.nii.gz'
, '/home/runner/nilearn_data/oasis1/OAS1_0198_MR1/mwrc1OAS1_0198_MR1_mpr_anon_fs
lswapdim_bet.nii.gz', '/home/runner/nilearn_data/oasis1/OAS1_0199_MR1/mwrc1OAS1_
0199_MR1_mpr_anon_fslswapdim_bet.nii.gz', '/home/runner/nilearn_data/oasis1/OAS1
_0200_MR1/mwrc1OAS1_0200_MR1_mpr_anon_fslswapdim_bet.nii.gz', '/home/runner/nile
arn_data/oasis1/OAS1_0201_MR1/mwrc1OAS1_0201_MR1_mpr_anon_fslswapdim_bet.nii.gz'
, '/home/runner/nilearn_data/oasis1/OAS1_0202_MR1/mwrc1OAS1_0202_MR1_mpr_anon_fs
lswapdim_bet.nii.gz', '/home/runner/nilearn_data/oasis1/OAS1_0203_MR1/mwrc1OAS1_
0203_MR1_mpr_anon_fslswapdim_bet.nii.gz', '/home/runner/nilearn_data/oasis1/OAS1
_0204_MR1/mwrc1OAS1_0204_MR1_mpr_anon_fslswapdim_bet.nii.gz', '/home/runner/nile
arn_data/oasis1/OAS1_0205_MR1/mwrc1OAS1_0205_MR1_mpr_anon_fslswapdim_bet.nii.gz'
, '/home/runner/nilearn_data/oasis1/OAS1_0206_MR1/mwrc1OAS1_0206_MR1_mpr_anon_fs
lswapdim_bet.nii.gz', '/home/runner/nilearn_data/oasis1/OAS1_0207_MR1/mwrc1OAS1_
0207_MR1_mpr_anon_fslswapdim_bet.nii.gz', '/home/runner/nilearn_data/oasis1/OAS1
_0208_MR1/mwrc1OAS1_0208_MR1_mpr_anon_fslswapdim_bet.nii.gz', '/home/runner/nile
arn_data/oasis1/OAS1_0209_MR1/mwrc1OAS1_0209_MR1_mpr_anon_fslswapdim_bet.nii.gz'
, '/home/runner/nilearn_data/oasis1/OAS1_0210_MR1/mwrc1OAS1_0210_MR1_mpr_anon_fs
lswapdim_bet.nii.gz', '/home/runner/nilearn_data/oasis1/OAS1_0211_MR1/mwrc1OAS1_
0211_MR1_mpr_anon_fslswapdim_bet.nii.gz', '/home/runner/nilearn_data/oasis1/OAS1
_0212_MR1/mwrc1OAS1_0212_MR1_mpr_anon_fslswapdim_bet.nii.gz', '/home/runner/nile
arn_data/oasis1/OAS1_0213_MR1/mwrc1OAS1_0213_MR1_mpr_anon_fslswapdim_bet.nii.gz'
, '/home/runner/nilearn_data/oasis1/OAS1_0214_MR1/mwrc1OAS1_0214_MR1_mpr_anon_fs
lswapdim_bet.nii.gz', '/home/runner/nilearn_data/oasis1/OAS1_0216_MR1/mwrc1OAS1_
0216_MR1_mpr_anon_fslswapdim_bet.nii.gz', '/home/runner/nilearn_data/oasis1/OAS1
_0217_MR1/mwrc1OAS1_0217_MR1_mpr_anon_fslswapdim_bet.nii.gz', '/home/runner/nile
arn_data/oasis1/OAS1_0218_MR1/mwrc1OAS1_0218_MR1_mpr_anon_fslswapdim_bet.nii.gz'
, '/home/runner/nilearn_data/oasis1/OAS1_0220_MR1/mwrc1OAS1_0220_MR1_mpr_anon_fs
lswapdim_bet.nii.gz', '/home/runner/nilearn_data/oasis1/OAS1_0221_MR1/mwrc1OAS1_
0221_MR1_mpr_anon_fslswapdim_bet.nii.gz', '/home/runner/nilearn_data/oasis1/OAS1
_0223_MR1/mwrc1OAS1_0223_MR1_mpr_anon_fslswapdim_bet.nii.gz', '/home/runner/nile
arn_data/oasis1/OAS1_0224_MR1/mwrc1OAS1_0224_MR1_mpr_anon_fslswapdim_bet.nii.gz'
, '/home/runner/nilearn_data/oasis1/OAS1_0226_MR1/mwrc1OAS1_0226_MR1_mpr_anon_fs
lswapdim_bet.nii.gz', '/home/runner/nilearn_data/oasis1/OAS1_0227_MR1/mwrc1OAS1_
0227_MR1_mpr_anon_fslswapdim_bet.nii.gz']
\[NiftiMasker.wrapped] Computing mask
\[NiftiMasker.wrapped] Resampling mask
\[NiftiMasker.wrapped] Finished fit
/home/runner/work/nilearn/nilearn/examples/02_decoding/plot_oasis_vbm.py:185: FutureWarning:

boolean values for 'standardize' will be deprecated in nilearn 0.15.0.
Use 'zscore_sample' instead of 'True' or use 'None' instead of 'False'.

\[NiftiMasker.wrapped] Loading data from <nibabel.nifti1.Nifti1Image object at
0x7f0bf5c387f0>
\[NiftiMasker.wrapped] Extracting region signals
\[NiftiMasker.wrapped] Cleaning extracted signals
[Parallel(n_jobs=2)]: Using backend LokyBackend with 2 concurrent workers.
[Parallel(n_jobs=2)]: Done   2 out of   2 | elapsed:   30.5s remaining:    0.0s
[Parallel(n_jobs=2)]: Done   2 out of   2 | elapsed:   30.5s finished
\[NiftiMasker.inverse_transform] Computing image from signals
________________________________________________________________________________
[Memory] Calling nilearn.masking.unmask...
unmask(array([[0., ..., 0.]]), <nibabel.nifti1.Nifti1Image object at 0x7f0c034409d0>)
___________________________________________________________unmask - 0.1s, 0.0min
Total running time of the script: (1 minutes 16.941 seconds)
Estimated memory usage: 6680 MB