Note
This page is a reference documentation. It only explains the function signature, and not how to use it. Please refer to the user guide for the big picture.
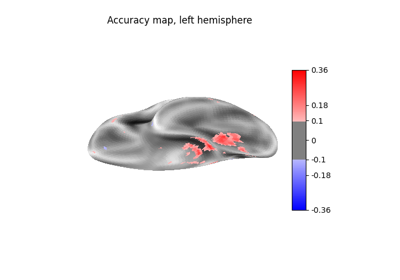
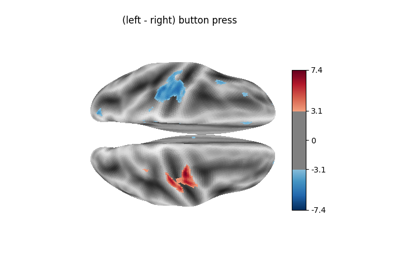
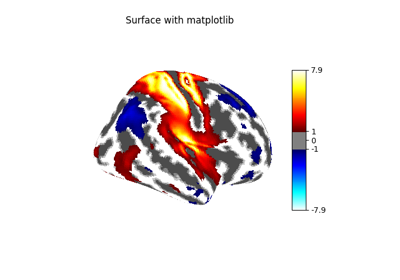
nilearn.plotting.plot_surf_stat_map
- nilearn.plotting.plot_surf_stat_map(surf_mesh=None, stat_map=None, bg_map=None, hemi='left', view=None, engine='matplotlib', cmap='RdBu_r', colorbar=True, avg_method=None, threshold=None, alpha=None, bg_on_data=False, vmin=None, vmax=None, symmetric_cbar='auto', cbar_tick_format='auto', title=None, title_font_size=None, output_file=None, axes=None, figure=None, **kwargs)[source]
Plot a stats map on a surface mesh with optional background.
Added in Nilearn 0.3.
- Parameters:
- surf_mesh
strorlistof twonumpy.ndarrayor aInMemoryMesh, or aPolyMesh, or None, default=None Surface mesh geometry, can be a file (valid formats are .gii or Freesurfer specific files such as .orig, .pial, .sphere, .white, .inflated) or a list of two Numpy arrays, the first containing the x-y-z coordinates of the mesh vertices, the second containing the indices (into coords) of the mesh faces, or a
InMemoryMeshobject with “coordinates” and “faces” attributes, or aPolyMeshobject, or None. If None is passed, thenstat_mapmust be aSurfaceImageinstance and the mesh from thatSurfaceImageinstance will be used.- stat_map
strornumpy.ndarrayor None, default=None Statistical map to be displayed on the surface mesh, can be a file (valid formats are .gii, .mgz, or Freesurfer specific files such as .thickness, .area, .curv, .sulc, .annot, .label) or a Numpy array with a value for each vertex of the surf_mesh. If None is passed for
surf_meshthenstat_mapmust be aSurfaceImageinstance and its the mesh will be used for plotting.When specified surf_map is of type
numpy.ndarray, to have a correct view, hemi should have a value corresponding to surf_map data.- bg_map
strorpathlib.Pathornumpy.ndarrayorSurfaceImageor None, default=None Background image to be plotted on the mesh underneath the surf_data in grayscale, most likely a sulcal depth map for realistic shading. If the map contains values outside [0, 1], it will be rescaled such that all values are in [0, 1]. Otherwise, it will not be modified. If a
strorpathlib.Pathis passed, it should be loadable to anumpy.ndarraybyload_surf_data. If anumpy.ndarrayis passed, if should have a shape (n_vertices, ), withn_verticesmatching that of the underlying mesh used for plotting.- hemi{“left”, “right”, “both”}, default=”left”
Hemisphere to display.
- view
str, or a pair offloatorint, default=”lateral” if hemi is “left” or “right”, if hemi is “both” “dorsal” If a string, and hemi is “left” or “right” must be in {“lateral”, “medial”, “dorsal”, “ventral”, “anterior”, “posterior”}. If hemi is “both”, must be in {“left”, “right”, “dorsal”, “ventral”, “anterior”, “posterior”}. If a sequence, must be a pair (elev, azim) of
floatorintangles in degrees that will manually set a custom view. E.g., view=[270.0, 90] or view=(0, -180.0). View of the surface that is rendered.- engine{‘matplotlib’, ‘plotly’}, default=’matplotlib’
Added in Nilearn 0.9.0.
Selects which plotting engine will be used by
plot_surf_stat_map. Currently, onlymatplotlibandplotlyare supported.Note
To use the
plotlyengine you need to haveplotlyinstalled.Note
To be able to save figures to disk with
plotlyengine you need to havekaleidoinstalled.To be able to save images with plotly, make sure that Google Chrome is installed! You can install a compatible Chrome version using the
kaleido_get_chromecommand in command line orkaleido.get_chrome_sync()function in Python.import kaleido kaleido.get_chrome_sync()
- cmap
matplotlib.colors.Colormap, orstr, optional The colormap to use. Either a string which is a name of a matplotlib colormap, or a matplotlib colormap object. default=”RdBu_r”
- colorbar
bool, optional If True, display a colorbar next to the plots.
Note
This function uses a symmetric colorbar for the statistical map.
default=True.
- avg_method{“mean”, “median”, “min”, “max”, custom function, None}, default=None
How to average vertex values to derive the face value:
"mean": results in smooth boundaries"median": results in sharp boundaries"min"or"max": for sparse matricescustom function: You can also pass a custom function which will be executed though
numpy.apply_along_axis. Here is an example of a custom function:def custom_function(vertices): return vertices[0] * vertices[1] * vertices[2]
Note
This option is currently only implemented for the
matplotlibengine.When using matplotlib as engine, avg_method will default to
"mean"ifNoneis passed.Added in Nilearn 0.10.3.
- threshold
intorfloat,str, None, or ‘auto’, optional If None is given, the image is not thresholded. If number is given, it must be non-negative. The specified value is used to threshold the image: values below the threshold (in absolute value) are plotted as transparent. If a string percentile is given, it should finish with percent sign e.g., “95%”. We threshold based on the score obtained using this percentile on the image data. If “auto” is given, the threshold is determined based on the score obtained using percentile value “80%” on the absolute value of the image data. default=None
- alpha
floator ‘auto’ or None, default=None Alpha level of the mesh (not the stat_map). Will default to
"auto"ifNoneis passed. If ‘auto’ is chosen, alpha will default to .5 when no bg_map is passed and to 1 if a bg_map is passed.Note
This option is currently only implemented for the
matplotlibengine.- bg_on_data
bool, default=False If True and a bg_map is specified, the surf_data data is multiplied by the background image, so that e.g. sulcal depth is jointly visible with surf_data. Otherwise, the background image will only be visible where there is no surface data (either because surf_data contains nans or because is was thresholded).
Note
This non-uniformly changes the surf_data values according to e.g the sulcal depth.
- vmin
floator obj:int or None, optional Lower bound of the colormap. The values below vmin are masked. If None, the min of the image is used. Passed to
matplotlib.pyplot.imshow.- vmax
floator obj:int or None, optional Upper bound of the colormap. The values above vmax are masked. If None, the max of the image is used. Passed to
matplotlib.pyplot.imshow.- symmetric_cbar
bool, or “auto”, default=”auto” Specifies whether the colorbar and colormap should range from -vmax to vmax (or from vmin to -vmin if -vmin is greater than vmax) or from vmin to vmax. Setting to “auto” (the default) will select the former if either vmin or vmax is None and the image has both positive and negative values.
- cbar_tick_format
str, optional Controls how to format the tick labels of the colorbar. Ex: use “%%.2g” to display using scientific notation. default=”auto” which will select:
‘%.2g’ (scientific notation) with
matplotlibengine.‘.1f’ (rounded floats) with
plotlyengine.
Added in Nilearn 0.7.1.
- title
str, or None, default=None The title displayed on the figure.
- title_font_size
int, default=None Size of the title font (only implemented for the plotly engine).
Added in Nilearn 0.9.0.
- output_file
strorpathlib.Pathor None, default=None The name of an image file to export the plot to. Valid extensions are .png, .pdf, .svg. If output_file is not None, the plot is saved to a file, and the display is closed.
- axesinstance of matplotlib axes or None, default=None
The axes instance to plot to. The projection must be ‘3d’ (e.g., figure, axes = plt.subplots(subplot_kw={‘projection’: ‘3d’}), where axes should be passed.). If None, a new axes is created.
Note
This option is currently only implemented for the
matplotlibengine.- figure
int, ormatplotlib.figure.Figure, or None, optional Matplotlib figure used or its number. If None is given, a new figure is created.
Note
This option is currently only implemented for the
matplotlibengine.- kwargs
dict, optional Keyword arguments passed to
nilearn.plotting.plot_surf.
- surf_mesh
See also
nilearn.datasets.fetch_surf_fsaverageFor surface data object to be used as background map for this plotting function.
nilearn.plotting.plot_surfFor brain surface visualization.
nilearn.surface.vol_to_surfFor info on the generation of surfaces.
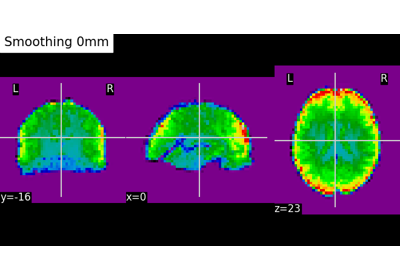
Examples using nilearn.plotting.plot_surf_stat_map
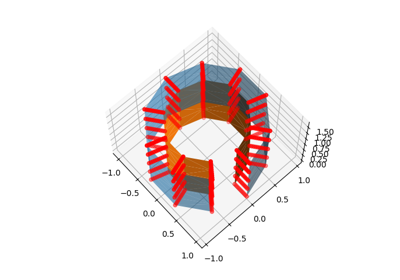
Technical point: Illustration of the volume to surface sampling schemes