Note
Go to the end to download the full example code. or to run this example in your browser via JupyterLite or Binder
Example of second level design matrix
This example shows how a second-level design matrix is specified: assuming that the data refer to a group of individuals, with one image per subject, the design matrix typically holds the characteristics of each individual.
This is used in a second-level analysis to assess the impact of these characteristics on brain signals.
This example requires matplotlib.
from nilearn._utils.helpers import check_matplotlib

check_matplotlib()

import matplotlib.pyplot as plt
Create a simple experimental paradigm
We want to get the group result of a contrast for 20 subjects.
n_subjects = 20
subjects_label = [f"sub-{int(i):02}" for i in range(1, n_subjects + 1)]
Next, we specify extra information about the subjects to create confounders. Without confounders the design matrix would correspond to a one sample test.
import pandas as pd

extra_info_subjects = pd.DataFrame(
    {
        "subject_label": subjects_label,
        "age": range(15, 15 + n_subjects),
        "sex": [0, 1] * (n_subjects // 2),
    }
)
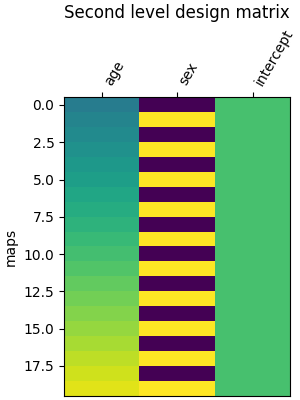
Create a second level design matrix
With that information we can create the second level design matrix.
from nilearn.glm.second_level import make_second_level_design_matrix

design_matrix = make_second_level_design_matrix(
    subjects_label, extra_info_subjects
)
/home/runner/work/nilearn/nilearn/examples/05_glm_second_level/plot_second_level_design_matrix.py:48: UserWarning:

Attention: Design matrix is singular. Aberrant estimates are expected.
Let’s plot it.
from nilearn.plotting import plot_design_matrix

fig, ax1 = plt.subplots(1, 1, figsize=(3, 4), constrained_layout=True)

ax = plot_design_matrix(design_matrix, axes=ax1)
ax.set_ylabel("maps")
ax.set_title("Second level design matrix", fontsize=12)
plt.show()
Total running time of the script: (0 minutes 2.145 seconds)
Estimated memory usage: 145 MB