Note
Go to the end to download the full example code or to run this example in your browser via Binder.
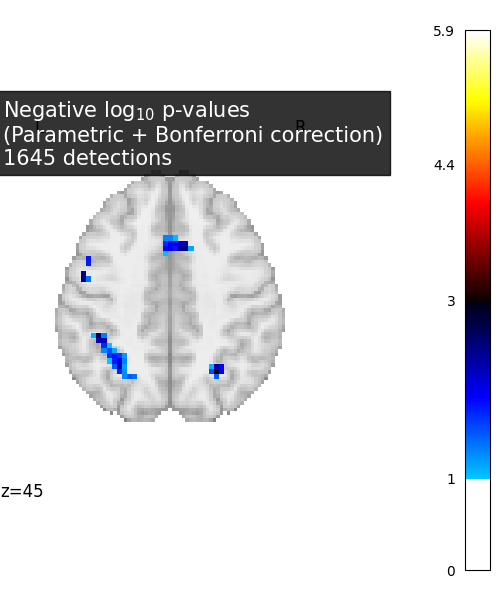
Massively univariate analysis of a calculation task from the Localizer dataset
This example shows how to use the Localizer dataset in a basic analysis. A standard Anova is performed (massively univariate F-test) and the resulting Bonferroni-corrected p-values are plotted. We use a calculation task and 20 subjects out of the 94 available.
The Localizer dataset contains many contrasts and subject-related variates. The user can refer to the plot_localizer_mass_univariate_methods.py example to see how to use these.
Warning
If you are using Nilearn with a version older than 0.9.0,
then you should either upgrade your version or import maskers
from the input_data module instead of the maskers module.
That is, you should manually replace in the following example all occurrences of:
from nilearn.maskers import NiftiMasker
with:
from nilearn.input_data import NiftiMasker
from nilearn._utils.helpers import check_matplotlib

check_matplotlib()

import matplotlib.pyplot as plt
import numpy as np

from nilearn import datasets
from nilearn.image import get_data
from nilearn.maskers import NiftiMasker
Load Localizer contrast
n_samples = 20
localizer_dataset = datasets.fetch_localizer_calculation_task(
    n_subjects=n_samples
)
tested_var = np.ones((n_samples, 1))
[fetch_localizer_calculation_task] Dataset found in
/home/runner/nilearn_data/brainomics_localizer
Mask data
nifti_masker = NiftiMasker(
    smoothing_fwhm=5, memory="nilearn_cache", memory_level=1, verbose=1
)
cmap_filenames = localizer_dataset.cmaps
fmri_masked = nifti_masker.fit_transform(cmap_filenames)
[NiftiMasker.wrapped] Loading data from
['/home/runner/nilearn_data/brainomics_localizer/brainomics_data/S01/cmaps_Audit
ory&VisualCalculation.nii.gz',
'/home/runner/nilearn_data/brainomics_localizer/brainomics_data/S02/cmaps_Audito
ry&VisualCalculation.nii.gz',
'/home/runner/nilearn_data/brainomics_localizer/brainomics_data/S03/cmaps_Audito
ry&VisualCalculation.nii.gz',
'/home/runner/nilearn_data/brainomics_localizer/brainomics_data/S04/cmaps_Audito
ry&VisualCalculation.nii.gz',
'/home/runner/nilearn_data/brainomics_localizer/brainomics_data/S05/cmaps_Audito
ry&VisualCalculation.nii.gz',
'/home/runner/nilearn_data/brainomics_localizer/brainomics_data/S06/cmaps_Audito
ry&VisualCalculation.nii.gz',
'/home/runner/nilearn_data/brainomics_localizer/brainomics_data/S07/cmaps_Audito
ry&VisualCalculation.nii.gz',
'/home/runner/nilearn_data/brainomics_localizer/brainomics_data/S08/cmaps_Audito
ry&VisualCalculation.nii.gz',
'/home/runner/nilearn_data/brainomics_localizer/brainomics_data/S09/cmaps_Audito
ry&VisualCalculation.nii.gz',
'/home/runner/nilearn_data/brainomics_localizer/brainomics_data/S10/cmaps_Audito
ry&VisualCalculation.nii.gz',
'/home/runner/nilearn_data/brainomics_localizer/brainomics_data/S11/cmaps_Audito
ry&VisualCalculation.nii.gz',
'/home/runner/nilearn_data/brainomics_localizer/brainomics_data/S12/cmaps_Audito
ry&VisualCalculation.nii.gz',
'/home/runner/nilearn_data/brainomics_localizer/brainomics_data/S13/cmaps_Audito
ry&VisualCalculation.nii.gz',
'/home/runner/nilearn_data/brainomics_localizer/brainomics_data/S14/cmaps_Audito
ry&VisualCalculation.nii.gz',
'/home/runner/nilearn_data/brainomics_localizer/brainomics_data/S15/cmaps_Audito
ry&VisualCalculation.nii.gz',
'/home/runner/nilearn_data/brainomics_localizer/brainomics_data/S16/cmaps_Audito
ry&VisualCalculation.nii.gz',
'/home/runner/nilearn_data/brainomics_localizer/brainomics_data/S17/cmaps_Audito
ry&VisualCalculation.nii.gz',
'/home/runner/nilearn_data/brainomics_localizer/brainomics_data/S18/cmaps_Audito
ry&VisualCalculation.nii.gz',
'/home/runner/nilearn_data/brainomics_localizer/brainomics_data/S19/cmaps_Audito
ry&VisualCalculation.nii.gz',
'/home/runner/nilearn_data/brainomics_localizer/brainomics_data/S20/cmaps_Audito
ry&VisualCalculation.nii.gz']
[NiftiMasker.wrapped] Computing mask
________________________________________________________________________________
[Memory] Calling nilearn.masking.compute_background_mask...
compute_background_mask([ '/home/runner/nilearn_data/brainomics_localizer/brainomics_data/S01/cmaps_Auditory&VisualCalculation.nii.gz',
  '/home/runner/nilearn_data/brainomics_localizer/brainomics_data/S02/cmaps_Auditory&VisualCalculation.nii.gz',
  '/home/runner/nilearn_data/brainomics_localizer/brainomics_data/S03/cmaps_Auditory&VisualCalculation.nii.gz',
  '/home/runner/nilearn_data/brainomics_localizer/brainomics_data/S04/cmaps_Auditory&VisualCalculation.nii.gz',
  '/home/runner/nilearn_data/brainomics_localizer/brainomics_data/S05/cmaps_Auditory&VisualCalculation.nii.gz',
  '/home/runner/nilearn_data/brainomics_localizer/brainomics_data/S06/cmaps_Auditory&VisualCalculation.nii.gz',
  '/home/runner/nilearn_data..., verbose=0)
__________________________________________compute_background_mask - 0.3s, 0.0min
[NiftiMasker.wrapped] Resampling mask
________________________________________________________________________________
[Memory] Calling nilearn.image.resampling.resample_img...
resample_img(<nibabel.nifti1.Nifti1Image object at 0x7f1ef05da260>, target_affine=None, target_shape=None, copy=False, interpolation='nearest')
_____________________________________________________resample_img - 0.0s, 0.0min
[NiftiMasker.wrapped] Finished fit
________________________________________________________________________________
[Memory] Calling nilearn.maskers.nifti_masker.filter_and_mask...
filter_and_mask([ '/home/runner/nilearn_data/brainomics_localizer/brainomics_data/S01/cmaps_Auditory&VisualCalculation.nii.gz',
  '/home/runner/nilearn_data/brainomics_localizer/brainomics_data/S02/cmaps_Auditory&VisualCalculation.nii.gz',
  '/home/runner/nilearn_data/brainomics_localizer/brainomics_data/S03/cmaps_Auditory&VisualCalculation.nii.gz',
  '/home/runner/nilearn_data/brainomics_localizer/brainomics_data/S04/cmaps_Auditory&VisualCalculation.nii.gz',
  '/home/runner/nilearn_data/brainomics_localizer/brainomics_data/S05/cmaps_Auditory&VisualCalculation.nii.gz',
  '/home/runner/nilearn_data/brainomics_localizer/brainomics_data/S06/cmaps_Auditory&VisualCalculation.nii.gz',
  '/home/runner/nilearn_data...,
<nibabel.nifti1.Nifti1Image object at 0x7f1ef05da260>, { 'clean_args': None,
  'clean_kwargs': {},
  'cmap': 'gray',
  'detrend': False,
  'dtype': None,
  'high_pass': None,
  'high_variance_confounds': False,
  'low_pass': None,
  'reports': True,
  'runs': None,
  'smoothing_fwhm': 5,
  'standardize': False,
  'standardize_confounds': True,
  't_r': None,
  'target_affine': None,
  'target_shape': None}, memory_level=1, memory=Memory(location=nilearn_cache/joblib), verbose=1, confounds=None, sample_mask=None, copy=True, dtype=None, sklearn_output_config=None)
[NiftiMasker.wrapped] Loading data from <nibabel.nifti1.Nifti1Image object at
0x7f1ef05d8940>
[NiftiMasker.wrapped] Smoothing images
[NiftiMasker.wrapped] Extracting region signals
[NiftiMasker.wrapped] Cleaning extracted signals
__________________________________________________filter_and_mask - 0.6s, 0.0min
Anova (parametric F-scores)
from sklearn.feature_selection import f_regression

# Center=False is used to not remove intercept
_, pvals_anova = f_regression(fmri_masked, tested_var.ravel(), center=False)
pvals_anova *= fmri_masked.shape[1]
pvals_anova[np.isnan(pvals_anova)] = 1
pvals_anova[pvals_anova > 1] = 1
neg_log_pvals_anova = -np.log10(pvals_anova)
neg_log_pvals_anova_unmasked = nifti_masker.inverse_transform(
    neg_log_pvals_anova
)
[NiftiMasker.inverse_transform] Computing image from signals
________________________________________________________________________________
[Memory] Calling nilearn.masking.unmask...
unmask(array([-0., ..., -0.], shape=(46815,)), <nibabel.nifti1.Nifti1Image object at 0x7f1ef05da260>)
___________________________________________________________unmask - 0.2s, 0.0min
Visualization
from nilearn.plotting import plot_stat_map, show

# Various plotting parameters
plotted_slice = 45
threshold = -np.log10(0.1)  # 10% corrected

masked_pvals = np.ma.masked_less(
    get_data(neg_log_pvals_anova_unmasked), threshold
)

title = (
    "Negative $\\log_{10}$ p-values"
    "\n(Parametric + Bonferroni correction)"
    f"\n{(~masked_pvals.mask).sum()} detections"
)

# Plot Anova p-values
display = plot_stat_map(
    neg_log_pvals_anova_unmasked,
    threshold=threshold,
    display_mode="z",
    cut_coords=[plotted_slice],
    figure=plt.figure(figsize=(5, 6), facecolor="w"),
    cmap="inferno",
    vmin=threshold,
    title=title,
)

show()
/home/runner/work/nilearn/nilearn/examples/07_advanced/plot_localizer_simple_analysis.py:90: UserWarning:

You are using the 'agg' matplotlib backend that is non-interactive.
No figure will be plotted when calling matplotlib.pyplot.show() or nilearn.plotting.show().
You can fix this by installing a different backend: for example via
        pip install PyQt6
Total running time of the script: (0 minutes 4.432 seconds)
Estimated memory usage: 107 MB