Note
Go to the end to download the full example code. or to run this example in your browser via JupyterLite or Binder
Visualizing Megatrawls Network Matrices from Human Connectome Project
This example shows how to fetch network matrices data from HCP beta-release of the Functional Connectivity Megatrawl project.
See fetch_megatrawls_netmats documentation and
the dataset description
for more details.
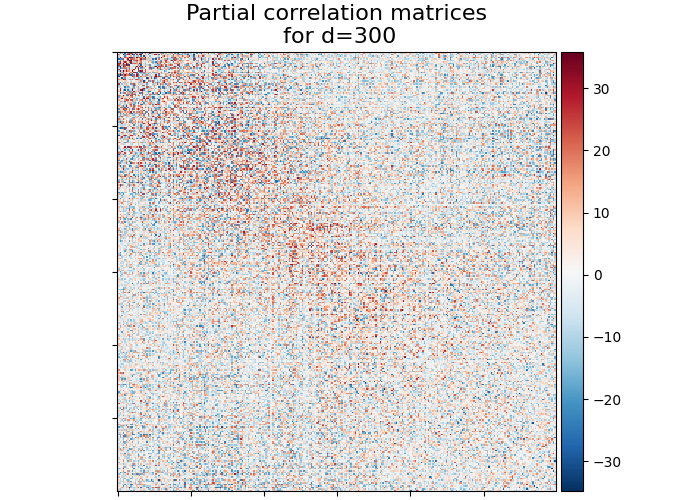
Fetching the Megatrawls Network matrices
Fetching the partial correlation matrices of dimensionality d=300 with timeseries method ‘eigen regression’
from nilearn.datasets import fetch_megatrawls_netmats

netmats = fetch_megatrawls_netmats(
    dimensionality=300,
    timeseries="eigen_regression",
    matrices="partial_correlation",
)
# Partial correlation matrices array of size (300, 300) are stored in the name
# of 'correlation_matrices'
partial_correlation = netmats.correlation_matrices.to_numpy()
[fetch_megatrawls_netmats] Dataset created in
/home/runner/nilearn_data/Megatrawls
[fetch_megatrawls_netmats] Downloading data from
http://www.nitrc.org/frs/download.php/8037/Megatrawls.tgz ...
[fetch_megatrawls_netmats] Downloaded 2596864 of 3066300 bytes (84.7%%, 00 HR 00
MIN 00 SEC remaining)
[fetch_megatrawls_netmats]  ...done. (2 seconds, 0 min)

[fetch_megatrawls_netmats] Extracting data from /home/runner/nilearn_data/Megatr
awls/3f1468dc43a408bf84510b07cee95049/Megatrawls.tgz...
[fetch_megatrawls_netmats] .. done.
Visualization
Import nilearn plotting modules to use its utilities for plotting correlation matrices
from nilearn.plotting import plot_matrix, show

title = "Partial correlation matrices\n for d=300"
display = plot_matrix(partial_correlation, title=title)
show()
Total running time of the script: (0 minutes 2.276 seconds)
Estimated memory usage: 145 MB