Note
Go to the end to download the full example code. or to run this example in your browser via JupyterLite or Binder
Simple example of NiftiMasker use
Here is a simple example of automatic mask computation using the nifti masker. The mask is computed and visualized.
Retrieve the brain development functional dataset
We fetch the dataset and print some basic information about it.
from nilearn.datasets import fetch_development_fmri

dataset = fetch_development_fmri(n_subjects=1)
func_filename = dataset.func[0]

print(f"First functional nifti image (4D) is at: {func_filename}")
[fetch_development_fmri] Dataset directory found:
/home/runner/nilearn_data/development_fmri
[fetch_development_fmri] Dataset directory found:
/home/runner/nilearn_data/development_fmri/development_fmri
[fetch_development_fmri] Dataset directory found:
/home/runner/nilearn_data/development_fmri/development_fmri
First functional nifti image (4D) is at: /home/runner/nilearn_data/development_fmri/development_fmri/sub-pixar123_task-pixar_space-MNI152NLin2009cAsym_desc-preproc_bold.nii.gz
Compute the mask
As the input image is an EPI image,
the background is noisy
and we cannot rely on the 'background' masking strategy.
We need to use the 'epi' one.
from nilearn.maskers import NiftiMasker

masker = NiftiMasker(
    mask_strategy="epi",
    memory="nilearn_cache",
    memory_level=1,
    smoothing_fwhm=8,
    verbose=1,
)
Note
When viewing an Nilearn estimator in a notebook (or more generally on an HTML page like here) you get an expandable ‘Parameters’ section where the parameters that have different values from their default are highlighted in orange. If you are using a version of scikit-learn >= 1.8.0 you will also get access to the ‘docstring’ description of each parameter.
\[NiftiMasker.fit] Loading data from '/home/runner/nilearn_data/development_fmri
/development_fmri/sub-pixar123_task-pixar_space-MNI152NLin2009cAsym_desc-preproc
_bold.nii.gz'
\[NiftiMasker.fit] Computing mask
________________________________________________________________________________
[Memory] Calling nilearn.masking.compute_epi_mask...
compute_epi_mask('/home/runner/nilearn_data/development_fmri/development_fmri/sub-pixar123_task-pixar_space-MNI152NLin2009cAsym_desc-preproc_bold.nii.gz', verbose=0)
_________________________________________________compute_epi_mask - 0.1s, 0.0min
\[NiftiMasker.fit] Resampling mask
________________________________________________________________________________
[Memory] Calling nilearn.image.resampling.resample_img...
resample_img(<nibabel.nifti1.Nifti1Image object at 0x7f0bf5f1c6d0>, target_affine=None, target_shape=None, copy=False, interpolation='nearest')
_____________________________________________________resample_img - 0.0s, 0.0min
\[NiftiMasker.fit] Finished fit
Note
You can also note that after fitting, the HTML representation of the estimator looks different than before fitting.
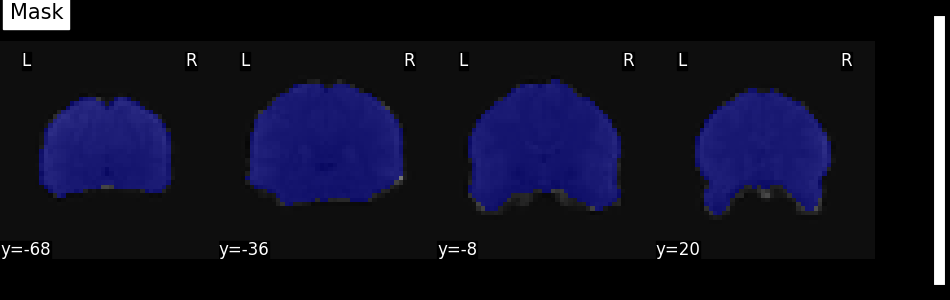
Visualize the mask
We can quickly get an idea about the estimated mask for this functional image by plotting the mask.
We get the estimated mask from the mask_img_ attribute of the masker:
the final _ of this attribute name means it was generated
by the fit method.
We can then plot it using the plot_roi function
with the mean functional image as background.
from nilearn.image.image import mean_img
from nilearn.plotting import plot_roi, show

mask_img = masker.mask_img_

mean_func_img = mean_img(func_filename)

plot_roi(mask_img, mean_func_img, display_mode="y", cut_coords=4, title="Mask")

show()
Visualize the masker report
More information can be obtained about the masker and its mask
by generating a masker report.
This can be done using
the generate_report method.
Here we use the ‘brainsprite’ engine
that gives an interactive visualization
instead of the static one generated
by the matplotlib engine.
report = masker.generate_report(engine="brainsprite")
/home/runner/work/nilearn/nilearn/.tox/doc/lib/python3.10/site-packages/numpy/core/fromnumeric.py:771: UserWarning:

Warning: 'partition' will ignore the 'mask' of the MaskedArray.
Note
The generated report can be:
displayed in a Notebook,
opened in a browser using the
.open_in_browser()method,or saved to a file using the
.save_as_html(output_filepath)method.
Preprocess data with the NiftiMasker
We extract the data from the nifti image and turn it into a numpy array.
/home/runner/work/nilearn/nilearn/examples/06_manipulating_images/plot_nifti_simple.py:110: FutureWarning:

boolean values for 'standardize' will be deprecated in nilearn 0.15.0.
Use 'zscore_sample' instead of 'True' or use 'None' instead of 'False'.

________________________________________________________________________________
[Memory] Calling nilearn.maskers.nifti_masker.filter_and_mask...
filter_and_mask('/home/runner/nilearn_data/development_fmri/development_fmri/sub-pixar123_task-pixar_space-MNI152NLin2009cAsym_desc-preproc_bold.nii.gz',
<nibabel.nifti1.Nifti1Image object at 0x7f0bf5f1c6d0>, { 'clean_args': None,
  'clean_kwargs': {},
  'cmap': 'gray',
  'detrend': False,
  'dtype': None,
  'high_pass': None,
  'high_variance_confounds': False,
  'low_pass': None,
  'reports': True,
  'runs': None,
  'smoothing_fwhm': 8,
  'standardize': False,
  'standardize_confounds': True,
  't_r': None,
  'target_affine': None,
  'target_shape': None}, memory_level=1, memory=Memory(location=nilearn_cache/joblib), verbose=1, confounds=None, sample_mask=None, copy=True, sklearn_output_config=None)
\[NiftiMasker.wrapped] Loading data from <nibabel.nifti1.Nifti1Image object at
0x7f0c0330b910>
\[NiftiMasker.wrapped] Smoothing images
\[NiftiMasker.wrapped] Extracting region signals
\[NiftiMasker.wrapped] Cleaning extracted signals
/home/runner/work/nilearn/nilearn/examples/06_manipulating_images/plot_nifti_simple.py:110: FutureWarning:

boolean values for 'standardize' will be deprecated in nilearn 0.15.0.
Use 'zscore_sample' instead of 'True' or use 'None' instead of 'False'.

__________________________________________________filter_and_mask - 0.7s, 0.0min
(168, 24256)
fmri_masked is now a 2D numpy array, (n_voxels x n_time_points).
Output to dataframe
You can also use ‘set_output()’ to decide the output format of ‘transform’. If you want to output to a DataFrame, you can choose ‘pandas’ or ‘polars’.
masker.set_output(transform="pandas")
fmri_masked = masker.transform(func_filename)
print(fmri_masked.head)
/home/runner/work/nilearn/nilearn/examples/06_manipulating_images/plot_nifti_simple.py:124: FutureWarning:

boolean values for 'standardize' will be deprecated in nilearn 0.15.0.
Use 'zscore_sample' instead of 'True' or use 'None' instead of 'False'.

________________________________________________________________________________
[Memory] Calling nilearn.maskers.nifti_masker.filter_and_mask...
filter_and_mask('/home/runner/nilearn_data/development_fmri/development_fmri/sub-pixar123_task-pixar_space-MNI152NLin2009cAsym_desc-preproc_bold.nii.gz',
<nibabel.nifti1.Nifti1Image object at 0x7f0bf5f1c6d0>, { 'clean_args': None,
  'clean_kwargs': {},
  'cmap': 'gray',
  'detrend': False,
  'dtype': None,
  'high_pass': None,
  'high_variance_confounds': False,
  'low_pass': None,
  'reports': True,
  'runs': None,
  'smoothing_fwhm': 8,
  'standardize': False,
  'standardize_confounds': True,
  't_r': None,
  'target_affine': None,
  'target_shape': None}, memory_level=1, memory=Memory(location=nilearn_cache/joblib), verbose=1, confounds=None, sample_mask=None, copy=True, sklearn_output_config={'transform': 'pandas'})
\[NiftiMasker.wrapped] Loading data from <nibabel.nifti1.Nifti1Image object at
0x7f0c0330b910>
\[NiftiMasker.wrapped] Smoothing images
\[NiftiMasker.wrapped] Extracting region signals
\[NiftiMasker.wrapped] Cleaning extracted signals
/home/runner/work/nilearn/nilearn/examples/06_manipulating_images/plot_nifti_simple.py:124: FutureWarning:

boolean values for 'standardize' will be deprecated in nilearn 0.15.0.
Use 'zscore_sample' instead of 'True' or use 'None' instead of 'False'.

__________________________________________________filter_and_mask - 0.7s, 0.0min
<bound method NDFrame.head of      niftimasker0  niftimasker1  ...  niftimasker24254  niftimasker24255
0      231.151675    284.128135  ...        361.287677        337.317492
1      229.076475    283.466586  ...        360.848745        337.620797
2      228.657047    284.225055  ...        360.505823        337.143531
3      231.614263    285.382944  ...        363.325545        339.963227
4      230.100950    286.330499  ...        363.504049        339.803485
..            ...           ...  ...               ...               ...
163    236.681694    285.878672  ...        361.143538        337.360280
164    237.212706    284.200024  ...        362.748403        339.990796
165    237.698720    285.862468  ...        362.163112        337.655142
166    237.412223    284.665597  ...        361.749148        337.040180
167    235.367764    283.362510  ...        363.289568        338.189685

[168 rows x 24256 columns]>
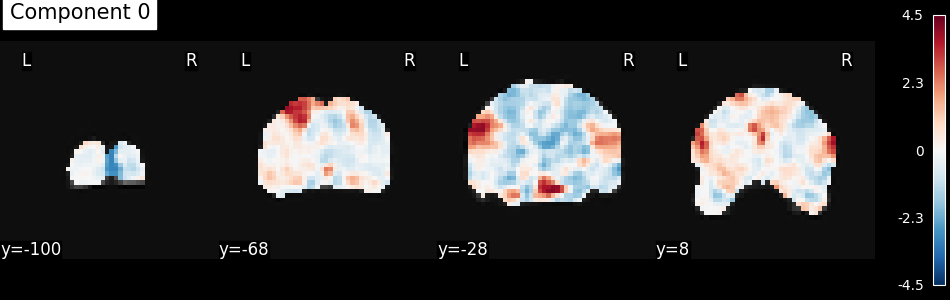
Run an algorithm and visualize the results
Given that we now have a numpy array,
we can then pass the data the wide range of algorithm.
Here we will just do an independent component analysis,
turned the extracted component back into images
(using inverse_transform),
then we will plot the first component.
from sklearn.decomposition import FastICA

from nilearn.image import index_img
from nilearn.plotting import plot_stat_map, show

ica = FastICA(n_components=10, random_state=42, tol=0.001, max_iter=2000)
components_masked = ica.fit_transform(fmri_masked.T).T

components = masker.inverse_transform(components_masked)

plot_stat_map(
    index_img(components, 0),
    mean_func_img,
    display_mode="y",
    cut_coords=4,
    title="Component 0",
)

show()
\[NiftiMasker.inverse_transform] Computing image from signals
________________________________________________________________________________
[Memory] Calling nilearn.masking.unmask...
unmask(array([[-1.0416  , ..., -0.558067],
       ...,
       [ 0.574022, ..., -0.41854 ]]),
<nibabel.nifti1.Nifti1Image object at 0x7f0bf5f1c6d0>)
___________________________________________________________unmask - 0.1s, 0.0min
Total running time of the script: (0 minutes 8.051 seconds)
Estimated memory usage: 616 MB