Note
This page is a reference documentation. It only explains the function signature, and not how to use it. Please refer to the user guide for the big picture.
nilearn.plotting.view_connectome
- nilearn.plotting.view_connectome(adjacency_matrix, node_coords, edge_threshold=None, edge_cmap='RdBu_r', symmetric_cmap=True, linewidth=6.0, node_color='auto', node_size=3.0, colorbar=True, colorbar_height=0.5, colorbar_fontsize=25, title=None, title_fontsize=25, node_labels=None)[source]
Insert a 3d plot of a connectome into an HTML page.
- Parameters:
- adjacency_matrix
numpy.ndarrayof shape=(n_nodes, n_nodes) The weights of the edges.
- node_coords
numpy.ndarrayof shape=(n_nodes, 3) The coordinates of the nodes in MNI space.
- node_colorcolor or sequence of colors, default=’auto’
Color(s) of the nodes.
- edge_threshold
str, number or None, default=None If None, no thresholding. If it is a number only connections of amplitude greater than threshold will be shown. If it is a string it must finish with a percent sign, e.g. “25.3%”, and only connections of amplitude above the given percentile will be shown.
- edge_cmap
stror matplotlib colormap, default=”RdBu_r” Colormap to use.
- symmetric_cmap
bool, default=True Make colormap symmetric (ranging from -vmax to vmax).
- linewidth
float, default=6.0 Width of the lines that show connections.
- node_size
float, default=3.0 Size of the markers showing the seeds in pixels.
- colorbar
bool, optional If True, display a colorbar next to the plots. default=True
- colorbar_height
float, default=0.5 Height of the colorbar, relative to the figure height.
- colorbar_fontsize
int, default=25 Fontsize of the colorbar tick labels.
- title
str, or None, default=None The title displayed on the figure.
- title_fontsize
int, default=25 Fontsize of the title.
- node_labels
listofstrof len=(n_nodes) or None, default=None Labels for the nodes.
Added in Nilearn 0.14.0.
- adjacency_matrix
- Returns:
- ConnectomeViewplot of the connectome.
It can be saved as an html page or rendered (transparently) by the Jupyter notebook. Useful methods are :
‘resize’ to resize the plot displayed in a Jupyter notebook
‘save_as_html’ to save the plot to a file
‘open_in_browser’ to save the plot and open it in a web browser.
See also
nilearn.plotting.plot_connectomeprojected views of a connectome in a glass brain.
nilearn.plotting.view_markersinteractive plot of colored markers
nilearn.plotting.view_surf,nilearn.plotting.view_img_on_surfinteractive view of statistical maps or surface atlases on the cortical surface.
Examples using nilearn.plotting.view_connectome

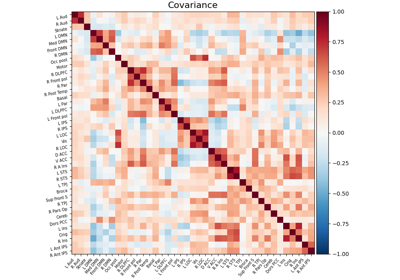
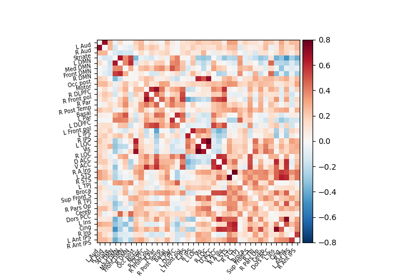
Computing a connectome with sparse inverse covariance
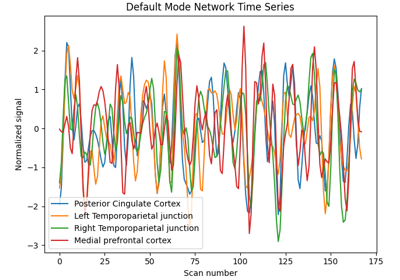
Extracting signals of a probabilistic atlas of functional regions