Note
This page is a reference documentation. It only explains the function signature, and not how to use it. Please refer to the user guide for the big picture.
nilearn.plotting.plot_img_comparison
- nilearn.plotting.plot_img_comparison(ref_imgs, src_imgs, masker=None, plot_hist=True, log=True, ref_label='image set 1', src_label='image set 2', output_dir=None, axes=None, colorbar=True)[source]
Create plots to compare two lists of images and measure correlation.
The first plot displays linear correlation between voxel values. The second plot superimposes histograms to compare values distribution.
- Parameters:
- ref_img3D Niimg-like object or
SurfaceImageor alistof 3D Niimg-like object orSurfaceImage Reference image.
- src_img3D Niimg-like object or
SurfaceImageor alistof 3D Niimg-like object orSurfaceImage Source image. Its type must match that of the
ref_img. If the source image is Niimg-Like, it will be resampled to match that or the source image.- masker3D Niimg-like binary mask or
NiftiMaskeror binarySurfaceImageor orSurfaceMaskeror None, default = None Mask to be used on data. Its type must be compatible with that of the
ref_img. IfNoneis passed, an appropriate masker will be fitted on the first reference image.- plot_hist
bool, default=True If True then histograms of each img in ref_imgs will be plotted along-side the histogram of the corresponding image in src_imgs.
- log
bool, default=True Passed to plt.hist.
- ref_label
str, default=’image set 1’ Name of reference images.
- src_label
str, default=’image set 2’ Name of source images.
- output_dir
stror None, default=None Directory where plotted figures will be stored.
- axes
listof two matplotlib Axes objects, or None, default=None Can receive a list of the form [ax1, ax2] to render the plots. By default new axes will be created.
- colorbar
bool, optional If True, display a colorbar next to the plots. default=True
- ref_img3D Niimg-like object or
- Returns:
- corrs
numpy.ndarray Pearson correlation between the images.
- corrs
Examples using nilearn.plotting.plot_img_comparison
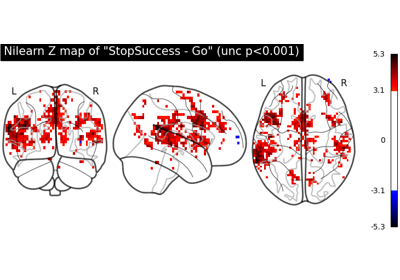
First level analysis of a complete BIDS dataset from openneuro