Note
This page is a reference documentation. It only explains the function signature, and not how to use it. Please refer to the user guide for the big picture.
nilearn.plotting.plot_img_on_surf
- nilearn.plotting.plot_img_on_surf(stat_map, surf_mesh='fsaverage5', mask_img=None, hemispheres=None, views=None, cmap='RdBu_r', colorbar=True, threshold=None, bg_on_data=False, inflate=False, vmin=None, vmax=None, symmetric_cbar='auto', cbar_tick_format='%i', title=None, output_file=None, **kwargs)[source]
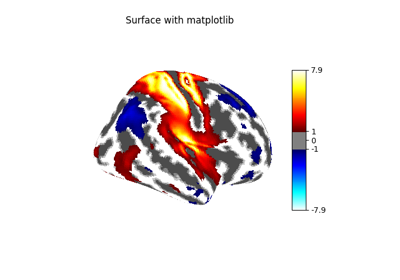
Plot multiple views of plot_surf_stat_map in a single figure.
It projects stat_map into meshes and plots views of left and right hemispheres. The views argument defines the views that are shown. This function returns the fig, axes elements from matplotlib unless kwargs sets and output_file, in which case nothing is returned.
- Parameters:
- stat_map
strorpathlib.Pathor 3D Niimg-like object - surf_mesh
str,dict, or None, default=’fsaverage5’ If str, either one of the two: ‘fsaverage5’: the low-resolution fsaverage5 mesh (10242 nodes) ‘fsaverage’: the high-resolution fsaverage mesh (163842 nodes) If dict, a dictionary with keys: [‘infl_left’, ‘infl_right’, ‘pial_left’, ‘pial_right’, ‘sulc_left’, ‘sulc_right’], where values are surface mesh geometries as accepted by plot_surf_stat_map.
- mask_imgNiimg-like object or None, default=None
The mask is passed to vol_to_surf. Samples falling out of this mask or out of the image are ignored during projection of the volume to the surface. If
None, don’t apply any mask.- hemispheres
listofstr, default=None Hemispheres to display. Will default to
['left', 'right']ifNoneor “both” is passed.- views
listofstr, default=None A list containing all views to display. The montage will contain as many rows as views specified by display mode. Order is preserved, and left and right hemispheres are shown on the left and right sides of the figure. Will default to
['lateral', 'medial']ifNoneis passed.- cmap
matplotlib.colors.Colormap, orstr, optional The colormap to use. Either a string which is a name of a matplotlib colormap, or a matplotlib colormap object. Default=”RdBu_r”.
- colorbar
bool, optional If True, display a colorbar next to the plots.
Note
This function uses a symmetric colorbar for the statistical map.
Default=True.
- threshold
intorfloat, None, or ‘auto’, optional If None is given, the image is not thresholded. If number is given, it must be non-negative. The specified value is used to threshold the image: values below the threshold (in absolute value) are plotted as transparent. If a string percentile is given, it should finish with percent sign e.g., “95%”. We threshold based on the score obtained using this percentile on the image data. If “auto” is given, the threshold is determined based on the score obtained using percentile value “80%” on the absolute value of the image data. Default=None
- bg_on_data
bool, default=False If True and a bg_map is specified, the surf_data data is multiplied by the background image, so that e.g. sulcal depth is jointly visible with surf_data. Otherwise, the background image will only be visible where there is no surface data (either because surf_data contains nans or because is was thresholded).
Note
This non-uniformly changes the surf_data values according to e.g the sulcal depth.
- inflate
bool, default=False If True, display images in inflated brain. If False, display images in pial surface.
- vmin
floator obj:int or None, optional Lower bound of the colormap. The values below vmin are masked. If None, the min of the image is used. Passed to
matplotlib.pyplot.imshow.- vmax
floator obj:int or None, optional Upper bound of the colormap. The values above vmax are masked. If None, the max of the image is used. Passed to
matplotlib.pyplot.imshow.- symmetric_cbar
bool, or “auto”, default=”auto” Specifies whether the colorbar and colormap should range from -vmax to vmax (or from vmin to -vmin if -vmin is greater than vmax) or from vmin to vmax. Setting to “auto” (the default) will select the former if either vmin or vmax is None and the image has both positive and negative values.
- cbar_tick_format
str, optional Controls how to format the tick labels of the colorbar. Ex: use “%%.2g” to display using scientific notation.
- title
str, or None, default=None The title displayed on the figure.
- output_file
strorpathlib.Pathor None, default=None The name of an image file to export the plot to. Valid extensions are .png, .pdf, .svg. If output_file is not None, the plot is saved to a file, and the display is closed.
- kwargs
dict, optional keyword arguments passed to plot_surf_stat_map.
Note
Parameters “figure”, “axes”, and “engine” which are valid for
plot_surf_stat_mapare not valid forplot_img_on_surf.
- stat_map
See also
nilearn.datasets.fetch_surf_fsaverageFor surface data object to be used as the default background map for this plotting function.
nilearn.surface.vol_to_surfFor info on the generation of surfaces.
nilearn.plotting.plot_surf_stat_mapFor info on kwargs options accepted by plot_img_on_surf.