Note
Go to the end to download the full example code. or to run this example in your browser via Binder
Second-level fMRI model: true positive proportion in clusters
This script showcases the so-called “All resolution inference” procedure (Rosenblatt et al.[1]), in which the proportion of true discoveries in arbitrary clusters is estimated. The clusters can be defined from the input image, i.e. in a circular way, as the error control accounts for arbitrary cluster selection.
Fetch dataset
We download a list of left vs right button press contrasts from a localizer dataset. Note that we fetch individual t-maps that represent the BOLD activity estimate divided by the uncertainty about this estimate.
from nilearn.datasets import fetch_localizer_contrasts

n_subjects = 16
data = fetch_localizer_contrasts(
    ["left vs right button press"],
    n_subjects,
)
[fetch_localizer_contrasts] Dataset found in
/home/runner/nilearn_data/brainomics_localizer
Estimate second level model
We define the input maps and the design matrix for the second level model and fit it.
import pandas as pd

second_level_input = data["cmaps"]
design_matrix = pd.DataFrame(
    [1] * len(second_level_input), columns=["intercept"]
)
Model specification and fit
from nilearn.glm.second_level import SecondLevelModel

second_level_model = SecondLevelModel(smoothing_fwhm=8.0, n_jobs=2, verbose=1)
second_level_model = second_level_model.fit(
    second_level_input, design_matrix=design_matrix
)
\[SecondLevelModel.fit] Fitting second level model. Take a deep breath.
\[SecondLevelModel.fit]
Computation of second level model done in 00 HR 00 MIN 00 SEC.
To estimate the contrast is very simple. We can just provide the column name of the design matrix.
z_map = second_level_model.compute_contrast(output_type="z_score")
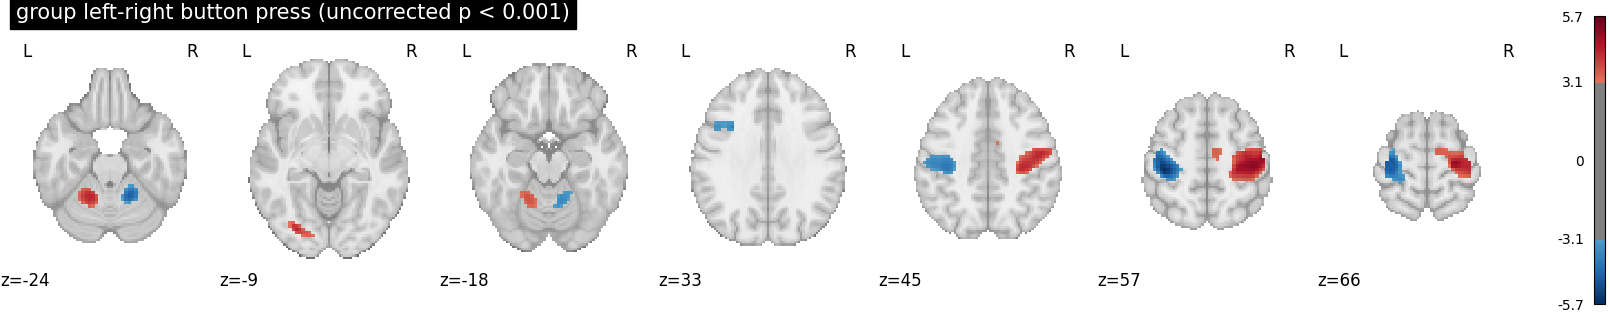
We threshold the second level contrast at uncorrected p < 0.001 and plot
from scipy.stats import norm
from nilearn.glm import cluster_level_inference
from nilearn.plotting import plot_stat_map, show
p_val = 0.001
p001_uncorrected = norm.isf(p_val)
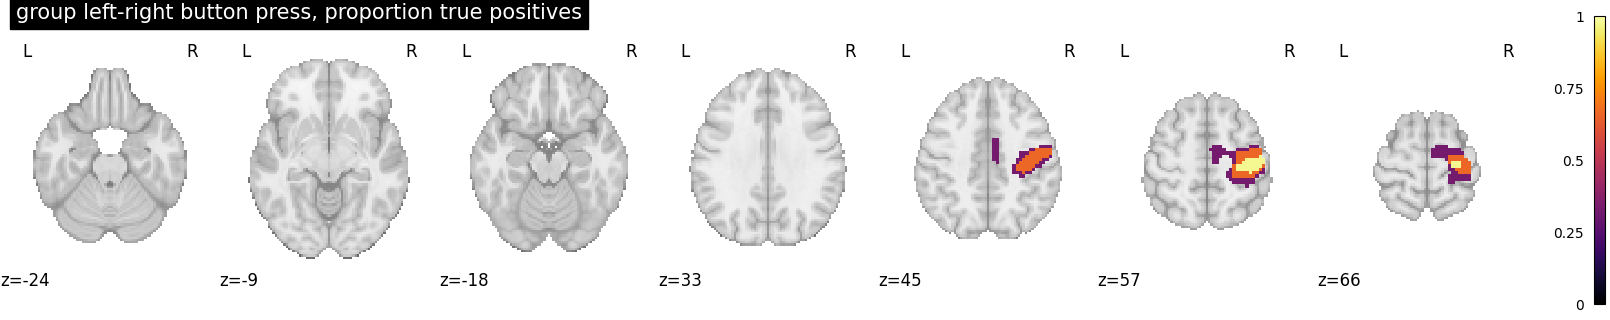
proportion_true_discoveries_img = cluster_level_inference(
z_map, threshold=[2.5, 3.5, 4.5], alpha=0.05
)
data = proportion_true_discoveries_img.get_fdata()
cut_coords = [-24, -9, -18, 33, 45, 57, 66]
plot_stat_map(
proportion_true_discoveries_img,
threshold=0.0,
display_mode="z",
vmax=1,
cmap="inferno",
title="group left-right button press, proportion true positives",
cut_coords=cut_coords,
)
plot_stat_map(
z_map,
threshold=p001_uncorrected,
display_mode="z",
title="group left-right button press (uncorrected p < 0.001)",
cut_coords=cut_coords,
)
show()
References
Total running time of the script: (0 minutes 2.698 seconds)
Estimated memory usage: 110 MB