Note
Go to the end to download the full example code. or to run this example in your browser via Binder
Smoothing an image
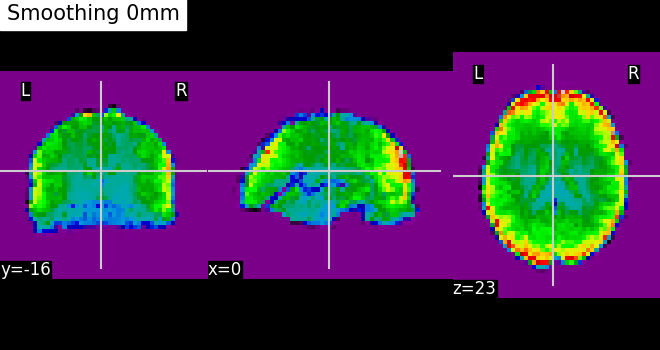
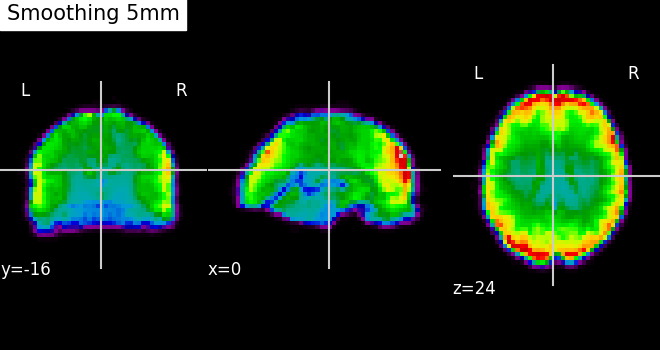
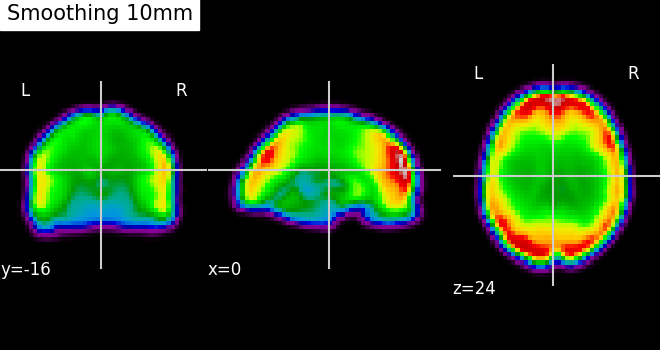
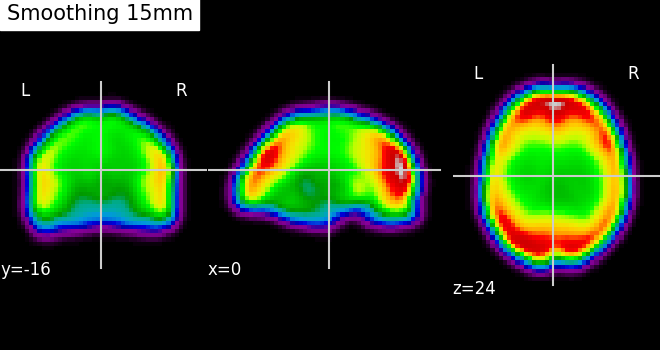
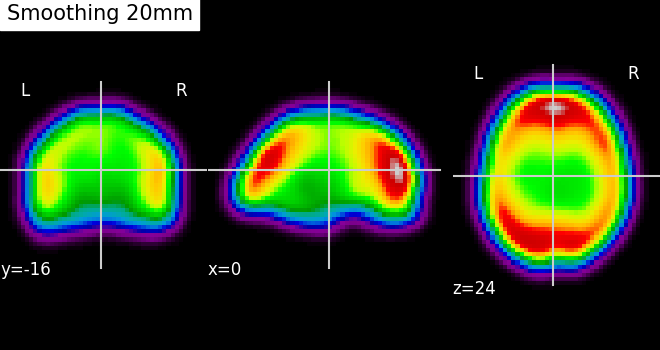
Here we smooth a mean EPI image and plot the result
As we vary the smoothing FWHM, note how we decrease the amount of noise, but also lose spatial details. In general, the best amount of smoothing for a given analysis depends on the spatial extent of the effects that are expected.
from nilearn import datasets, image, plotting

data = datasets.fetch_development_fmri(n_subjects=1)

# Print basic information on the dataset
print(
    f"First subject functional nifti image (4D) are located at: {data.func[0]}"
)

first_epi_file = data.func[0]

# First compute the mean image, from the 4D series of image
mean_func = image.mean_img(first_epi_file, copy_header=True)
[fetch_development_fmri] Dataset found in
/home/runner/nilearn_data/development_fmri
[fetch_development_fmri] Dataset found in
/home/runner/nilearn_data/development_fmri/development_fmri
[fetch_development_fmri] Dataset found in
/home/runner/nilearn_data/development_fmri/development_fmri
First subject functional nifti image (4D) are located at: /home/runner/nilearn_data/development_fmri/development_fmri/sub-pixar123_task-pixar_space-MNI152NLin2009cAsym_desc-preproc_bold.nii.gz
Then we smooth, with a varying amount of smoothing, from none to 20mm by increments of 5mm
for smoothing in [None, 5, 10, 15, 20, 25]:
    smoothed_img = image.smooth_img(mean_func, smoothing)
    title = (
        "No smoothing" if smoothing is None else f"Smoothing {smoothing} mm"
    )
    plotting.plot_epi(smoothed_img, title=title)

plotting.show()
Total running time of the script: (0 minutes 3.804 seconds)
Estimated memory usage: 295 MB
