Note
This page is a reference documentation. It only explains the function signature, and not how to use it. Please refer to the user guide for the big picture.
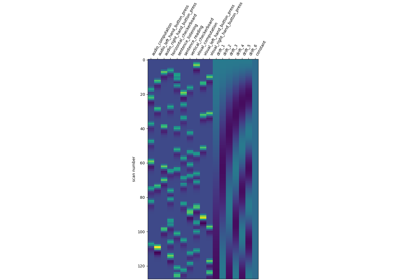
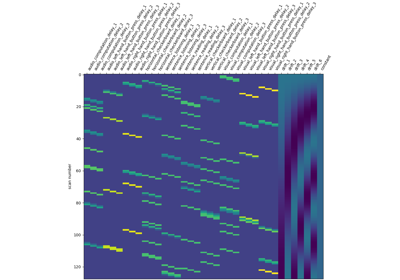
nilearn.plotting.plot_contrast_matrix
- nilearn.plotting.plot_contrast_matrix(contrast_def, design_matrix, colorbar=True, axes=None, output_file=None)[source]
Create plot for contrast definition.
- Parameters:
- contrast_def
strornumpy.ndarrayof shape[1] <= n_col wheren_colis the number of columns of the design matrix. The string can be a formula compatible with
pandas.DataFrame.eval. Basically one can use the name of the conditions as they appear in the design matrix of the fitted model combined with operators +- and combined with numbers with operators +-*/.- design_matrix
pandas.DataFrame Design matrix to use.
- colorbar
bool, optional If True, display a colorbar next to the plots. default=True.
- axes
matplotlib.axes.Axesor None, default=None Axis on which to plot the figure. If None, a new figure will be created.
- output_file
strorpathlib.Pathor None, default=None The name of an image file to export the plot to. Valid extensions are .png, .pdf, .svg. If output_file is not None, the plot is saved to a file, and the display is closed.
- contrast_def
- Returns:
- axes
matplotlib.axes.Axes Figure object.
- axes
Examples using nilearn.plotting.plot_contrast_matrix
Intro to GLM Analysis: a single-run, single-subject fMRI dataset
Analysis of an fMRI dataset with a Finite Impule Response (FIR) model
First level analysis of a complete BIDS dataset from openneuro