Note
This page is a reference documentation. It only explains the function signature, and not how to use it. Please refer to the user guide for the big picture.
nilearn.plotting.plot_design_matrix_correlation
- nilearn.plotting.plot_design_matrix_correlation(design_matrix, tri='full', cmap='RdBu_r', colorbar=True, output_file=None, **kwargs)[source]
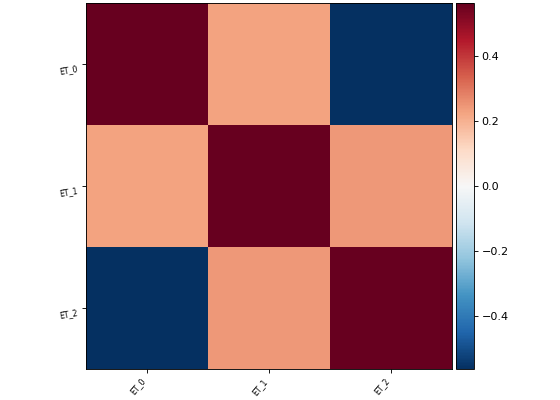
Compute and plot the correlation between regressor of a design matrix.
The drift and constant regressors are omitted from the plot.
Added in Nilearn 0.11.0.
- Parameters:
- design_matrix
pandas.DataFrame,pandas.DataFramepathlib.Path Design matrix whose correlation matrix you want to plot.
- tri{“full”, “diag”}, default=”full”
Which triangular part of the matrix to plot:
"diag": Plot the lower part with the diagonal"full": Plot the full matrix
- cmap
matplotlib.colors.Colormap, orstr, optional The colormap to use. Either a string which is a name of a matplotlib colormap, or a matplotlib colormap object. default=”RdBu_r”
This must be a diverging colormap as the correlation matrix will be centered on 0. The allowed colormaps are:
"bwr""RdBu_r""seismic_r"
- colorbar
bool, optional If True, display a colorbar next to the plots.
- output_file
strorpathlib.Pathor None, default=None The name of an image file to export the plot to. Valid extensions are .png, .pdf, .svg. If output_file is not None, the plot is saved to a file, and the display is closed.
- kwargsextra keyword arguments, optional
Extra keyword arguments are sent to
nilearn.plotting.plot_matrix
- design_matrix
- Returns:
- display
matplotlib.axes.Axes Axes image.
- display
Examples
>>> import numpy as np
>>> from pandas import DataFrame
>>> from nilearn.glm.first_level import make_first_level_design_matrix
>>> from nilearn.plotting import plot_design_matrix_correlation
>>> from nilearn.plotting.image.img_plotting import show
>>>
>>> #creating a design matrix
>>>
>>> frame_times = np.arange(25)
>>> onsets = np.arange(9)
>>> duration = np.linspace(1, 9, 9)
>>> trial_type = ["ET_0", "ET_0", "ET_0",
...               "ET_1", "ET_1", "ET_1",
...               "ET_2", "ET_2", "ET_2"]
>>> events = DataFrame({"trial_type": trial_type,
...                     "onset": onsets,
...                     "duration": duration})
>>>
>>> design_matrix = make_first_level_design_matrix(frame_times, events)
>>>
>>> ax = plot_design_matrix_correlation(design_matrix)
>>> show()