Note
This page is a reference documentation. It only explains the function signature, and not how to use it. Please refer to the user guide for the big picture.
nilearn.plotting.show#
- nilearn.plotting.show()[source]#
Show all the figures generated by nilearn and/or matplotlib.
This function is equivalent to
matplotlib.pyplot.show, but is skipped on the ‘Agg’ backend where it has no effect other than to emit a warning.
Examples using nilearn.plotting.show#
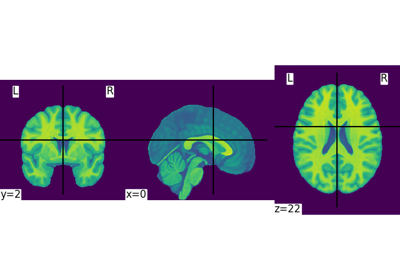
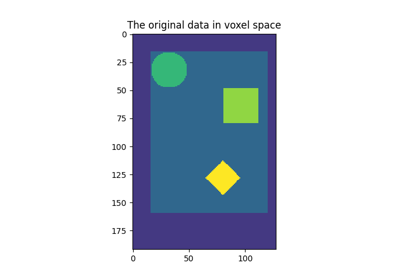
Basic nilearn example: manipulating and looking at data
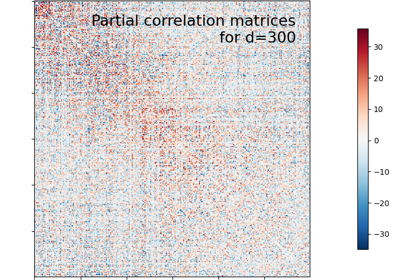
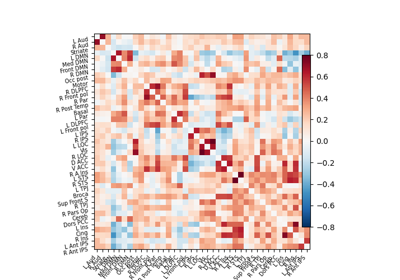
Visualizing Megatrawls Network Matrices from Human Connectome Project
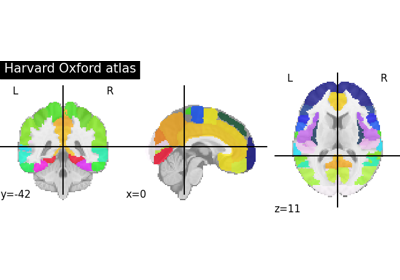
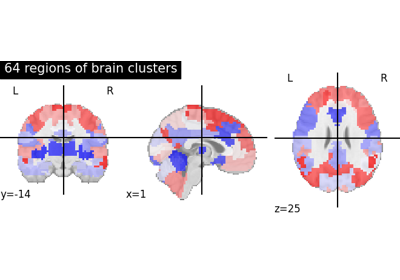
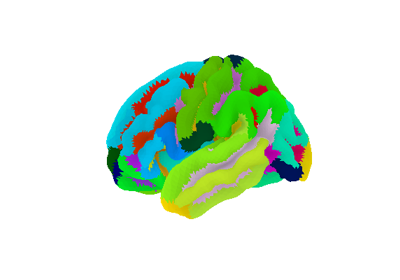
Visualizing multiscale functional brain parcellations
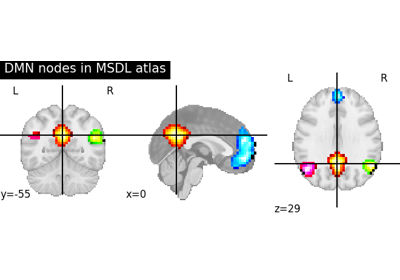
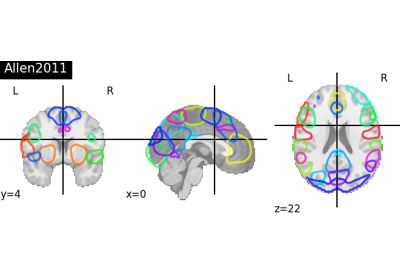
Visualizing a probabilistic atlas: the default mode in the MSDL atlas
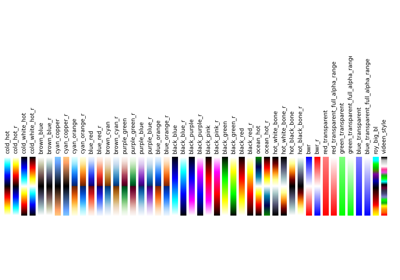
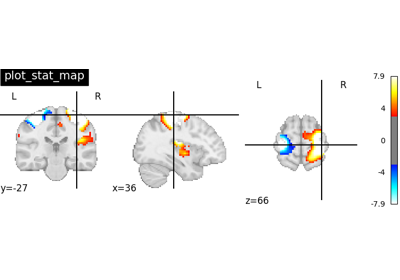
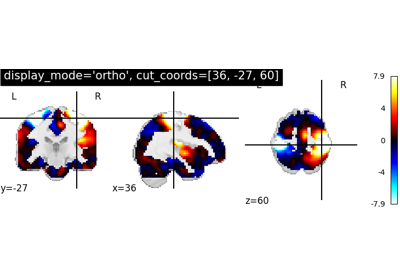
Controlling the contrast of the background when plotting
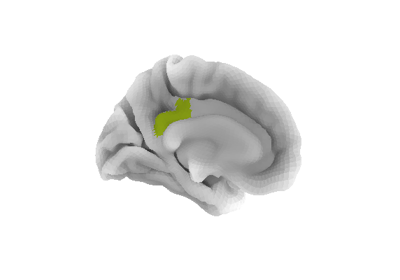
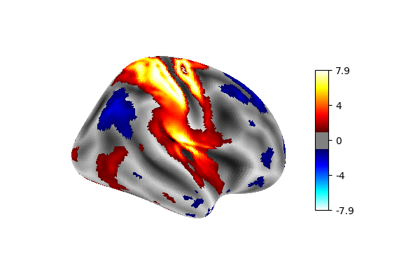
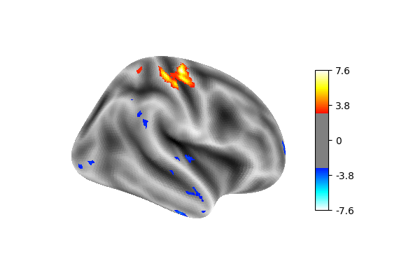
Technical point: Illustration of the volume to surface sampling schemes

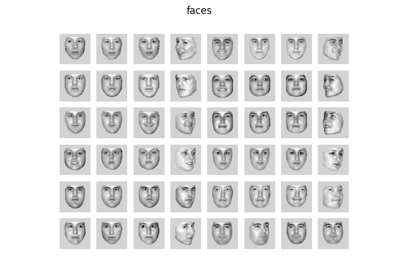
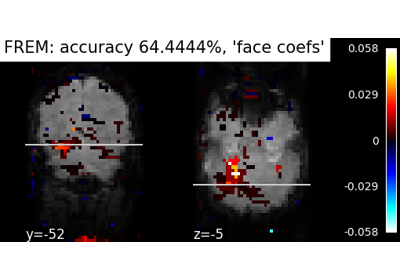
Decoding with FREM: face vs house object recognition
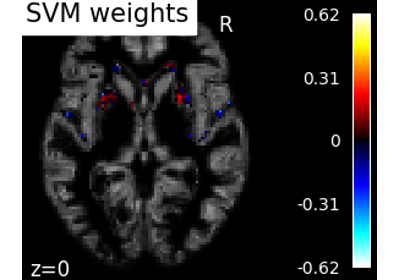
Voxel-Based Morphometry on Oasis dataset with Space-Net prior
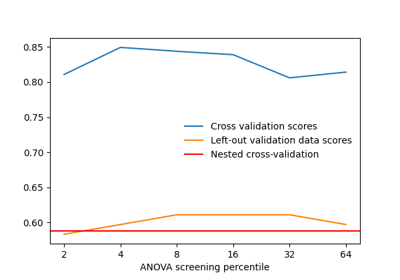
Decoding with ANOVA + SVM: face vs house in the Haxby dataset
The haxby dataset: different multi-class strategies
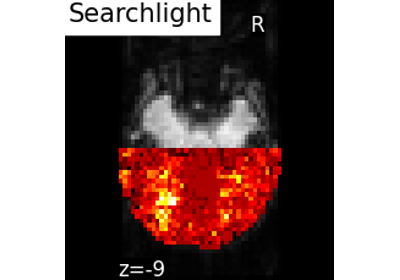
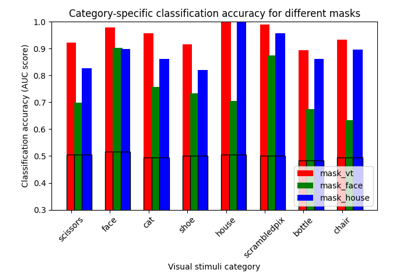
ROI-based decoding analysis in Haxby et al. dataset
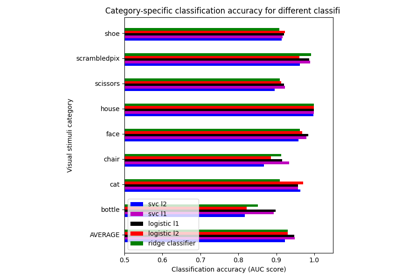
Different classifiers in decoding the Haxby dataset
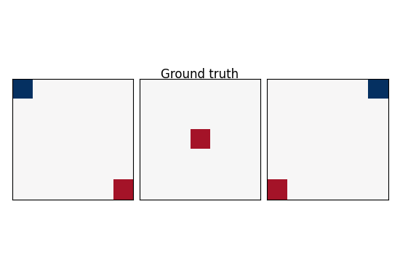
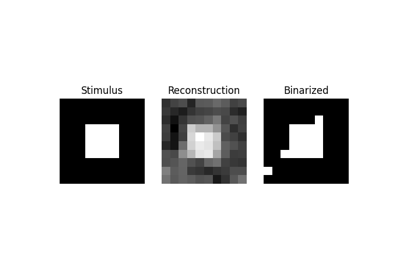
Reconstruction of visual stimuli from Miyawaki et al. 2008
Extracting signals of a probabilistic atlas of functional regions
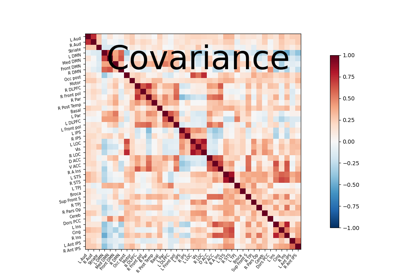
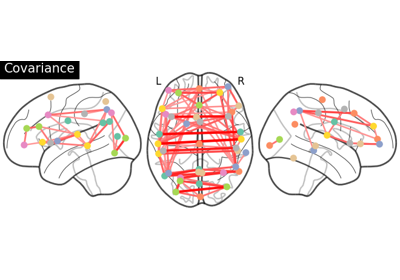
Computing a connectome with sparse inverse covariance
Connectivity structure estimation on simulated data
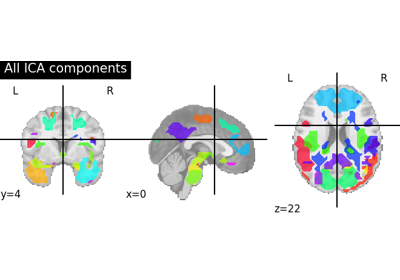
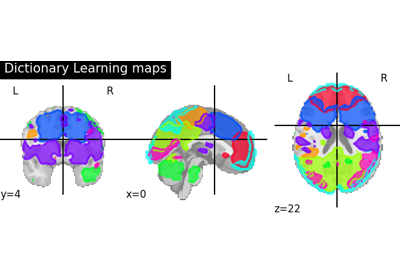
Deriving spatial maps from group fMRI data using ICA and Dictionary Learning
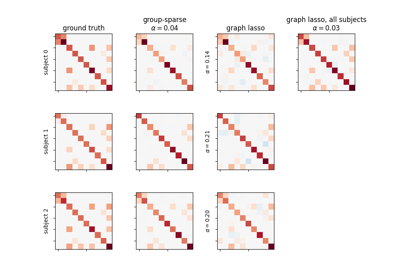
Group Sparse inverse covariance for multi-subject connectome
Regions extraction using dictionary learning and functional connectomes
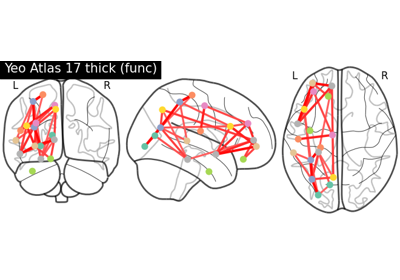
Comparing connectomes on different reference atlases
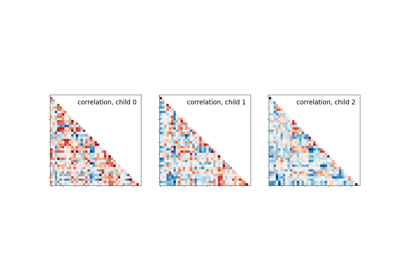
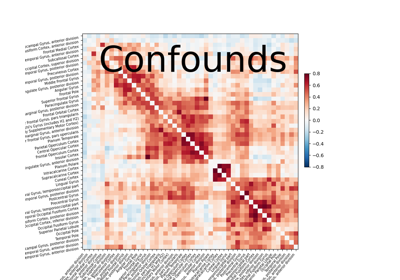
Classification of age groups using functional connectivity
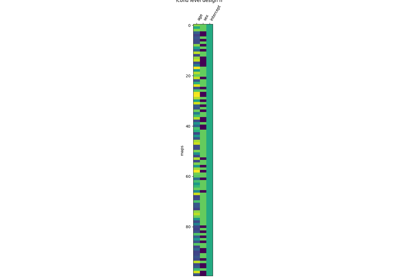
Example of explicit fixed effects fMRI model fitting
Single-subject data (two sessions) in native space
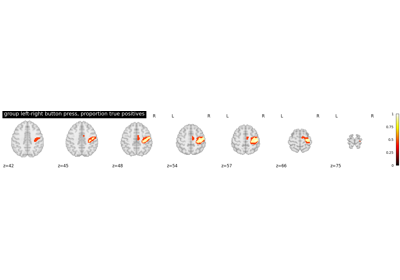
Second-level fMRI model: true positive proportion in clusters
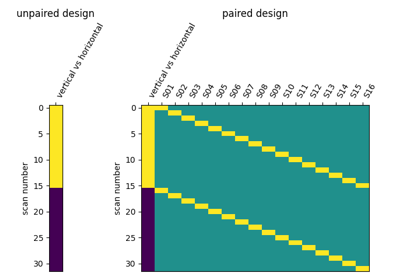
Second-level fMRI model: two-sample test, unpaired and paired
Regions Extraction of Default Mode Networks using Smith Atlas
Computing a Region of Interest (ROI) mask manually
Multivariate decompositions: Independent component analysis of fMRI
Massively univariate analysis of a calculation task from the Localizer dataset
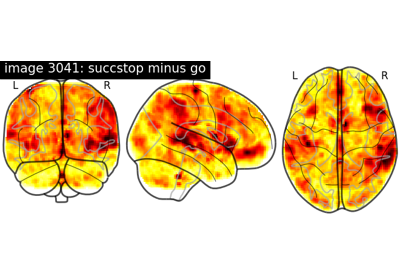
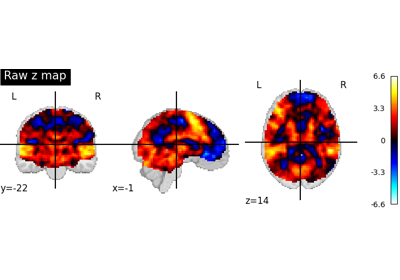
NeuroVault meta-analysis of stop-go paradigm studies.
Surface-based dataset first and second level analysis of a dataset
Massively univariate analysis of face vs house recognition