Note
Click here to download the full example code or to run this example in your browser via Binder
Basic Atlas plotting#
Plot the regions of a reference atlas (Harvard-Oxford and Juelich atlases).
Retrieving the atlas data#
from nilearn import datasets

dataset_ho = datasets.fetch_atlas_harvard_oxford('cort-maxprob-thr25-2mm')
dataset_ju = datasets.fetch_atlas_juelich('maxprob-thr0-1mm')

atlas_ho_filename = dataset_ho.filename
atlas_ju_filename = dataset_ju.filename

print('Atlas ROIs are located at: %s' % atlas_ho_filename)
print('Atlas ROIs are located at: %s' % atlas_ju_filename)
Atlas ROIs are located at: /home/yasmin/nilearn_data/fsl/data/atlases/HarvardOxford/HarvardOxford-cort-maxprob-thr25-2mm.nii.gz
Atlas ROIs are located at: /home/yasmin/nilearn_data/fsl/data/atlases/Juelich/Juelich-maxprob-thr0-1mm.nii.gz
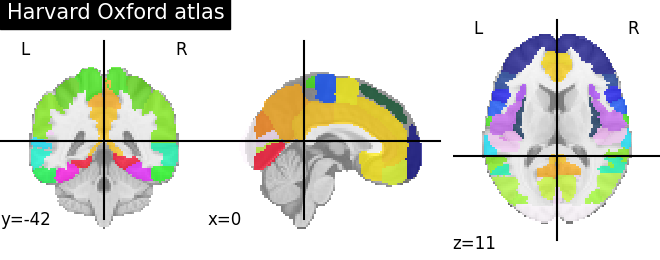
Visualizing the Harvard-Oxford atlas#
from nilearn import plotting

plotting.plot_roi(atlas_ho_filename, title="Harvard Oxford atlas")

<nilearn.plotting.displays._slicers.OrthoSlicer object at 0x7f127523bee0>
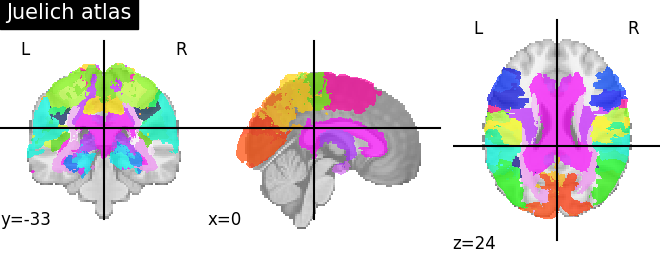
Visualizing the Juelich atlas#
plotting.plot_roi(atlas_ju_filename, title="Juelich atlas")

<nilearn.plotting.displays._slicers.OrthoSlicer object at 0x7f1274e34d90>
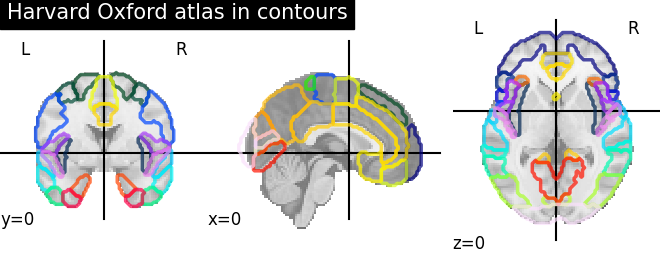
Visualizing the Harvard-Oxford atlas with contours#
plotting.plot_roi(atlas_ho_filename, view_type='contours',
                  title="Harvard Oxford atlas in contours")
plotting.show()

/home/yasmin/nilearn/nilearn/nilearn/plotting/img_plotting.py:572: UserWarning: Data array used to create a new image contains 64-bit ints. This is likely due to creating the array with numpy and passing `int` as the `dtype`. Many tools such as FSL and SPM cannot deal with int64 in Nifti images, so for compatibility the data has been converted to int32.
  img = new_img_like(roi_img, data, affine=roi_img.affine)
/home/yasmin/nilearn/nilearn/nilearn/plotting/displays/_axes.py:71: UserWarning: No contour levels were found within the data range.
  im = getattr(ax, type)(data_2d.copy(),
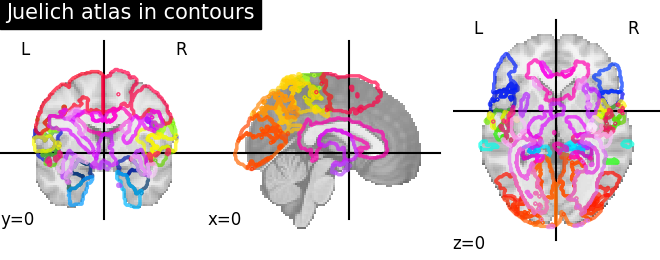
Visualizing the Juelich atlas with contours#
plotting.plot_roi(atlas_ju_filename, view_type='contours',
                  title="Juelich atlas in contours")
plotting.show()

/home/yasmin/nilearn/nilearn/nilearn/plotting/img_plotting.py:572: UserWarning: Data array used to create a new image contains 64-bit ints. This is likely due to creating the array with numpy and passing `int` as the `dtype`. Many tools such as FSL and SPM cannot deal with int64 in Nifti images, so for compatibility the data has been converted to int32.
  img = new_img_like(roi_img, data, affine=roi_img.affine)
/home/yasmin/nilearn/nilearn/nilearn/plotting/displays/_axes.py:71: UserWarning: No contour levels were found within the data range.
  im = getattr(ax, type)(data_2d.copy(),
Total running time of the script: ( 1 minutes 17.812 seconds)
Estimated memory usage: 146 MB