Note
This page is a reference documentation. It only explains the function signature, and not how to use it. Please refer to the user guide for the big picture.
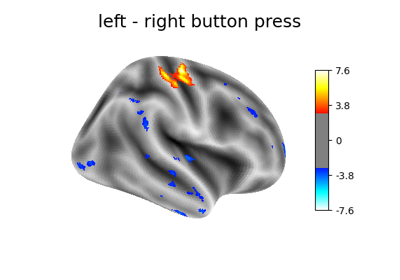
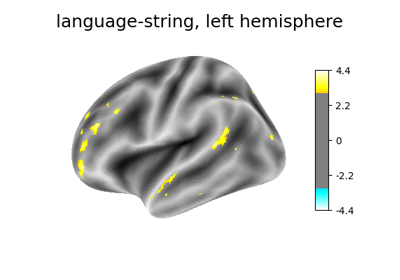
8.11.19. nilearn.plotting.plot_surf_stat_map
- nilearn.plotting.plot_surf_stat_map(surf_mesh, stat_map, bg_map=None, hemi='left', view='lateral', engine='matplotlib', threshold=None, alpha='auto', vmax=None, cmap='cold_hot', colorbar=True, symmetric_cbar='auto', cbar_tick_format='auto', bg_on_data=False, darkness=1, title=None, title_font_size=18, output_file=None, axes=None, figure=None, **kwargs)[source]
Plotting a stats map on a surface mesh with optional background
New in version 0.3.
- Parameters
- surf_meshstr or list of two numpy.ndarray or Mesh
Surface mesh geometry, can be a file (valid formats are .gii or Freesurfer specific files such as .orig, .pial, .sphere, .white, .inflated) or a list of two Numpy arrays, the first containing the x-y-z coordinates of the mesh vertices, the second containing the indices (into coords) of the mesh faces, or a Mesh object with “coordinates” and “faces” attributes.
- stat_mapstr or numpy.ndarray
Statistical map to be displayed on the surface mesh, can be a file (valid formats are .gii, .mgz, .nii, .nii.gz, or Freesurfer specific files such as .thickness, .area, .curv, .sulc, .annot, .label) or a Numpy array with a value for each vertex of the surf_mesh.
- bg_mapSurface data object (to be defined), optional
Background image to be plotted on the mesh underneath the stat_map in greyscale, most likely a sulcal depth map for realistic shading.
- hemi{‘left’, ‘right’}, optional
Hemisphere to display. Default=’left’.
- view{‘lateral’, ‘medial’, ‘dorsal’, ‘ventral’, ‘anterior’, ‘posterior’}, optional
View of the surface that is rendered. Default=’lateral’.
- engine{‘matplotlib’, ‘plotly’}, optional
New in version 0.9.0.
Selects which plotting engine will be used by
plot_surf_stat_map. Currently, onlymatplotlibandplotlyare supported.Note
To use the
plotlyengine you need to haveplotlyinstalled.Note
To be able to save figures to disk with the
plotlyengine you need to havekaleidoinstalled.Warning
The
plotlyengine is new and experimental. Please report bugs that you may encounter.Default=’matplotlib’.
- thresholda number or None, optional
If None is given, the image is not thresholded. If a number is given, it is used to threshold the image, values below the threshold (in absolute value) are plotted as transparent.
- cmap
matplotlib.colors.Colormap, orstr, optional The colormap to use. Either a string which is a name of a matplotlib colormap, or a matplotlib colormap object.
- cbar_tick_format
str, optional Controls how to format the tick labels of the colorbar. Ex: use “%%.2g” to display using scientific notation. Default=”auto” which will select:
‘%.2g’ (scientific notation) with
matplotlibengine.‘.1f’ (rounded floats) with
plotlyengine.
New in version 0.7.1.
- colorbar
bool, optional If
True, display a colorbar on the right of the plots.Note
This function uses a symmetric colorbar for the statistical map.
Default=True.
- alphafloat or ‘auto’, optional
Alpha level of the mesh (not the stat_map). If ‘auto’ is chosen, alpha will default to .5 when no bg_map is passed and to 1 if a bg_map is passed. Default=’auto’.
Note
This option is currently only implemented for the
matplotlibengine.- vmax
float, optional Upper bound of the colormap. If
None, the max of the image is used. Passed tomatplotlib.pyplot.imshow.- symmetric_cbar
bool, or ‘auto’, optional Specifies whether the colorbar should range from
-vmaxtovmaxor fromvmintovmax. Setting to ‘auto’ will select the latter if the range of the whole image is either positive or negative.Note
The colormap will always range from
-vmaxtovmax.Default=’auto’.
- bg_on_data
bool, optional If
True, and abg_mapis specified, thesurf_datadata is multiplied by the background image, so that e.g. sulcal depth is visible beneath thesurf_data.Note
This non-uniformly changes the surf_data values according to e.g the sulcal depth.
Default=False.
- darkness
floatbetween 0 and 1, optional Specifying the darkness of the background image:
‘1’ indicates that the original values of the background are used
‘.5’ indicates that the background values are reduced by half before being applied.
Default=1.
Note
This option is currently only implemented for the
matplotlibengine.- title
str, or None, optional The title displayed on the figure. Default=None.
- title_font_size
int, optional Size of the title font.
New in version 0.9.0.
Default=18.
- output_file
str, or None, optional The name of an image file to export the plot to. Valid extensions are .png, .pdf, .svg. If
output_fileis not None, the plot is saved to a file, and the display is closed.- axesinstance of matplotlib axes, None, optional
The axes instance to plot to. The projection must be ‘3d’ (e.g., figure, axes = plt.subplots(subplot_kw={‘projection’: ‘3d’}), where axes should be passed.). If None, a new axes is created.
Note
This option is currently only implemented for the
matplotlibengine.- figure
int, ormatplotlib.figure.Figure, or None, optional Matplotlib figure used or its number. If
Noneis given, a new figure is created.Note
This option is currently only implemented for the
matplotlibengine.- kwargsdict, optional
Keyword arguments passed to
nilearn.plotting.plot_surf.
See also
nilearn.datasets.fetch_surf_fsaverageFor surface data object to be used as background map for this plotting function.
nilearn.plotting.plot_surfFor brain surface visualization.
nilearn.surface.vol_to_surfFor info on the generation of surfaces.