Note
Click here to download the full example code or to run this example in your browser via Binder
9.3.10. Setting a parameter by cross-validation
Here we set the number of features selected in an Anova-SVC approach to maximize the cross-validation score.
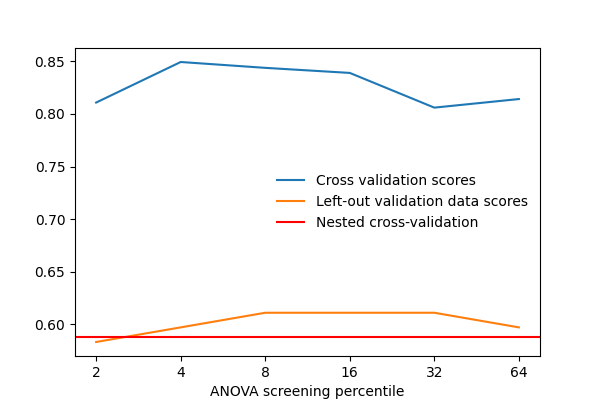
After separating 2 sessions for validation, we vary that parameter and measure the cross-validation score. We also measure the prediction score on the left-out validation data. As we can see, the two scores vary by a significant amount: this is due to sampling noise in cross validation, and choosing the parameter k to maximize the cross-validation score, might not maximize the score on left-out data.
Thus using data to maximize a cross-validation score computed on that same data is likely to optimistic and lead to an overfit.
The proper approach is known as a “nested cross-validation”. It consists in doing cross-validation loops to set the model parameters inside the cross-validation loop used to judge the prediction performance: the parameters are set separately on each fold, never using the data used to measure performance.
For decoding task, in nilearn, this can be done using the nilearn.decoding.Decoder object, that will automatically select the best parameters of an estimator from a grid of parameter values.
One difficulty is that the Decoder object is a composite estimator: a pipeline of feature selection followed by Support Vector Machine. Tuning the SVM’s parameters is already done automatically inside the Decoder, but performing cross-validation for the feature selection must be done manually.
9.3.10.1. Load the Haxby dataset
from nilearn import datasets
# by default 2nd subject data will be fetched on which we run our analysis
haxby_dataset = datasets.fetch_haxby()
fmri_img = haxby_dataset.func[0]
mask_img = haxby_dataset.mask

# print basic information on the dataset
print('Mask nifti image (3D) is located at: %s' % haxby_dataset.mask)
print('Functional nifti image (4D) are located at: %s' % haxby_dataset.func[0])

# Load the behavioral data
import pandas as pd
labels = pd.read_csv(haxby_dataset.session_target[0], sep=" ")
y = labels['labels']


# Keep only data corresponding to shoes or bottles
from nilearn.image import index_img
condition_mask = y.isin(['shoe', 'bottle'])

fmri_niimgs = index_img(fmri_img, condition_mask)
y = y[condition_mask]
session = labels['chunks'][condition_mask]
Out:
Mask nifti image (3D) is located at: /home/nicolas/nilearn_data/haxby2001/mask.nii.gz
Functional nifti image (4D) are located at: /home/nicolas/nilearn_data/haxby2001/subj2/bold.nii.gz
9.3.10.2. ANOVA pipeline with nilearn.decoding.Decoder object
Nilearn Decoder object aims to provide smooth user experience by acting as a pipeline of several tasks: preprocessing with NiftiMasker, reducing dimension by selecting only relevant features with ANOVA – a classical univariate feature selection based on F-test, and then decoding with different types of estimators (in this example is Support Vector Machine with a linear kernel) on nested cross-validation.
9.3.10.3. Fit the Decoder and predict the responses
As a complete pipeline by itself, decoder will perform cross-validation for the estimator, in this case Support Vector Machine. We can output the best parameters selected for each cross-validation fold. See https://scikit-learn.org/stable/modules/cross_validation.html for an excellent explanation of how cross-validation works.
First we fit the Decoder
decoder.fit(fmri_niimgs, y)
for i, (param, cv_score) in enumerate(zip(decoder.cv_params_['shoe']['C'],
                                          decoder.cv_scores_['shoe'])):

    print("Fold %d | Best SVM parameter: %.1f with score: %.3f" % (i + 1,
          param, cv_score))
# Output the prediction with Decoder
y_pred = decoder.predict(fmri_niimgs)
Out:
Fold 1 | Best SVM parameter: 100.0 with score: 0.901
Fold 2 | Best SVM parameter: 100.0 with score: 0.918
Fold 3 | Best SVM parameter: 1.0 with score: 0.738
Fold 4 | Best SVM parameter: 100.0 with score: 0.749
Fold 5 | Best SVM parameter: 100.0 with score: 0.736
9.3.10.4. Compute prediction scores with different values of screening percentile
import numpy as np
screening_percentile_range = [2, 4, 8, 16, 32, 64]
cv_scores = []
val_scores = []

for sp in screening_percentile_range:
    decoder = Decoder(estimator='svc', mask=mask_img,
                      smoothing_fwhm=4, cv=3, standardize=True,
                      screening_percentile=sp)
    decoder.fit(index_img(fmri_niimgs, session < 10),
                y[session < 10])
    cv_scores.append(np.mean(decoder.cv_scores_['bottle']))
    print("Sreening Percentile: %.3f" % sp)
    print("Mean CV score: %.4f" % cv_scores[-1])

    y_pred = decoder.predict(index_img(fmri_niimgs, session == 10))
    val_scores.append(np.mean(y_pred == y[session == 10]))
    print("Validation score: %.4f" % val_scores[-1])
Out:
Sreening Percentile: 2.000
Mean CV score: 0.8107
Validation score: 0.6111
Sreening Percentile: 4.000
Mean CV score: 0.8493
Validation score: 0.3889
Sreening Percentile: 8.000
Mean CV score: 0.8437
Validation score: 0.4444
Sreening Percentile: 16.000
Mean CV score: 0.8389
Validation score: 0.5000
Sreening Percentile: 32.000
Mean CV score: 0.8059
Validation score: 0.4444
Sreening Percentile: 64.000
Mean CV score: 0.8141
Validation score: 0.4444
9.3.10.5. Nested cross-validation
We are going to tune the parameter ‘screening_percentile’ in the pipeline.
from sklearn.model_selection import KFold
cv = KFold(n_splits=3)
nested_cv_scores = []

for train, test in cv.split(session):
    y_train = np.array(y)[train]
    y_test = np.array(y)[test]
    val_scores = []

    for sp in screening_percentile_range:
        decoder = Decoder(estimator='svc', mask=mask_img,
                          smoothing_fwhm=4, cv=3, standardize=True,
                          screening_percentile=sp)
        decoder.fit(index_img(fmri_niimgs, train), y_train)
        y_pred = decoder.predict(index_img(fmri_niimgs, test))
        val_scores.append(np.mean(y_pred == y_test))

    nested_cv_scores.append(np.max(val_scores))

print("Nested CV score: %.4f" % np.mean(nested_cv_scores))
Out:
Nested CV score: 0.5880
9.3.10.6. Plot the prediction scores using matplotlib
from matplotlib import pyplot as plt
from nilearn.plotting import show

plt.figure(figsize=(6, 4))
plt.plot(cv_scores, label='Cross validation scores')
plt.plot(val_scores, label='Left-out validation data scores')
plt.xticks(np.arange(len(screening_percentile_range)),
           screening_percentile_range)
plt.axis('tight')
plt.xlabel('ANOVA screening percentile')

plt.axhline(np.mean(nested_cv_scores),
            label='Nested cross-validation',
            color='r')

plt.legend(loc='best', frameon=False)
show()

Total running time of the script: ( 1 minutes 33.025 seconds)
Estimated memory usage: 915 MB
