Note
This page is a reference documentation. It only explains the function signature, and not how to use it. Please refer to the user guide for the big picture.
8.10.16. nilearn.plotting.plot_carpet
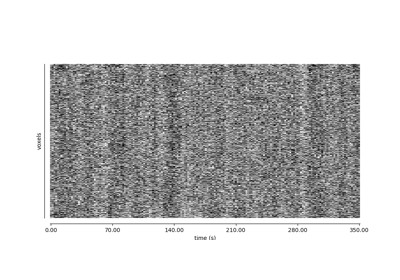
nilearn.plotting.plot_carpet(img, mask_img=None, mask_labels=None, detrend=True, output_file=None, figure=None, axes=None, vmin=None, vmax=None, title=None, cmap=<matplotlib.colors.LinearSegmentedColormap object>)¶Plot an image representation of voxel intensities across time.
This figure is also known as a “grayplot” or “Power plot”.
- Parameters
- imgNiimg-like object
4D image. See http://nilearn.github.io/manipulating_images/input_output.html.
- mask_imgNiimg-like object or None, optional
Limit plotted voxels to those inside the provided mask (default is None). If a 3D atlas is provided, voxels will be grouped by atlas value and a colorbar will be added to the left side of the figure with atlas labels. If not specified, a new mask will be derived from data. See http://nilearn.github.io/manipulating_images/input_output.html.
- mask_labels
dict, optional If
mask_imgcorresponds to an atlas, then this dictionary maps values from themask_imgto labels. Dictionary keys are labels and values are values within the atlas.- detrend
bool, optional Detrend and z-score the data prior to plotting. Default=True.
- output_file
stror None, optional The name of an image file to which to export the plot (default is None). Valid extensions are .png, .pdf, and .svg. If output_file is not None, the plot is saved to a file, and the display is closed.
- figure
matplotlib.figure.Figureor None, optional Matplotlib figure used (default is None). If None is given, a new figure is created.
- axesmatplotlib axes or None, optional
The axes used to display the plot (default is None). If None, the complete figure is used.
- vminfloat or None, optional
Lower bound for plotting, passed to matplotlib.pyplot.imshow. If None, vmin will be automatically determined based on the data. Default=None.
- vmaxfloat or None, optional
Upper bound for plotting, passed to matplotlib.pyplot.imshow. If None, vmax will be automatically determined based on the data. Default=None.
- title
stror None, optional The title displayed on the figure (default is None).
- cmapmatplotlib colormap, optional
The colormap for the sidebar, if an atlas is used. Default=plt.cm.gist_ncar.
- Returns
- figure
matplotlib.figure.Figure Figure object with carpet plot.
- figure
Notes
This figure was originally developed in [1].
In cases of long acquisitions (>800 volumes), the data will be downsampled to have fewer than 800 volumes before being plotted.
References
- 1
Power, J. D. (2017). A simple but useful way to assess fMRI scan qualities. Neuroimage, 154, 150-158. doi: https://doi.org/10.1016/j.neuroimage.2016.08.009