Note
Click here to download the full example code or to run this example in your browser via Binder
9.2.9. Controling the contrast of the background when plotting
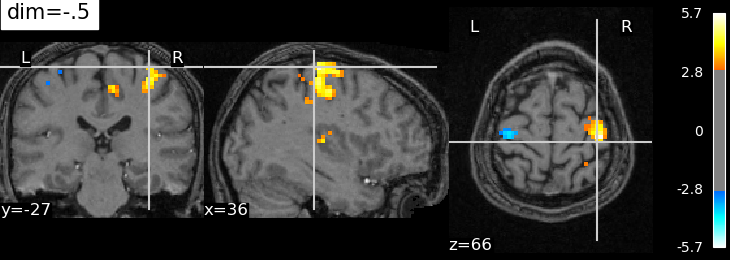
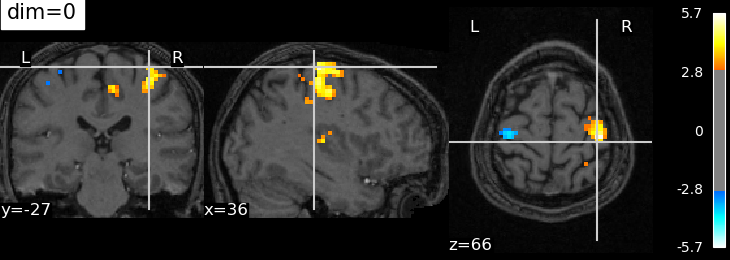
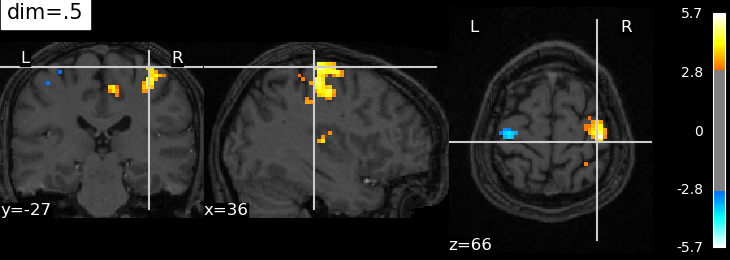
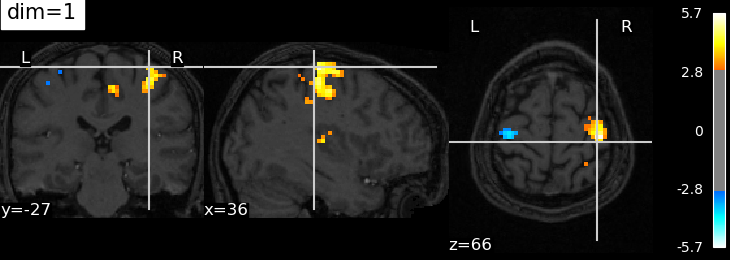
The dim argument controls the contrast of the background.
dim modifies the contrast of this image: dim=0 leaves the image unchanged, negative values of dim enhance it, and positive values decrease it (dim the background).
This dim argument may also be useful for the plot_roi function used to display ROIs on top of a background image.
9.2.9.1. Retrieve the data: the localizer dataset with contrast maps
from nilearn import datasets

localizer_dataset = datasets.fetch_localizer_button_task()
# Contrast map of motor task
localizer_tmap_filename = localizer_dataset.tmap
# Subject specific anatomical image
localizer_anat_filename = localizer_dataset.anat
Out:
Downloading data from https://osf.io/download/5d275ede1c5b4a001aa00c26/ ...
 ...done. (3 seconds, 0 min)
/usr/lib/python3/dist-packages/numpy/lib/npyio.py:2358: VisibleDeprecationWarning: Reading unicode strings without specifying the encoding argument is deprecated. Set the encoding, use None for the system default.
  output = genfromtxt(fname, **kwargs)
9.2.9.2. Plotting with enhancement of background image with dim=-.5
from nilearn import plotting
plotting.plot_stat_map(localizer_tmap_filename,
                       bg_img=localizer_anat_filename,
                       cut_coords=(36, -27, 66),
                       threshold=3, title="dim=-.5",
                       dim=-.5)
Out:
<nilearn.plotting.displays.OrthoSlicer object at 0x7f8bfc6bffa0>
9.2.9.3. Plotting with no change of contrast in background image with dim=0
plotting.plot_stat_map(localizer_tmap_filename,
                       bg_img=localizer_anat_filename,
                       cut_coords=(36, -27, 66),
                       threshold=3, title="dim=0",
                       dim=0)
Out:
<nilearn.plotting.displays.OrthoSlicer object at 0x7f8bfc6e5a00>
9.2.9.4. Plotting with decrease of constrast in background image with dim=.5
plotting.plot_stat_map(localizer_tmap_filename,
                       bg_img=localizer_anat_filename,
                       cut_coords=(36, -27, 66),
                       threshold=3, title="dim=.5",
                       dim=.5)
Out:
<nilearn.plotting.displays.OrthoSlicer object at 0x7f8bfc623220>
9.2.9.5. Plotting with more decrease in constrast with dim=1
plotting.plot_stat_map(localizer_tmap_filename,
                       bg_img=localizer_anat_filename,
                       cut_coords=(36, -27, 66),
                       threshold=3, title="dim=1",
                       dim=1)

plotting.show()
Total running time of the script: ( 0 minutes 7.352 seconds)
