Note
Click here to download the full example code or to run this example in your browser via Binder
9.2.3. Visualizing global patterns with a carpet plot
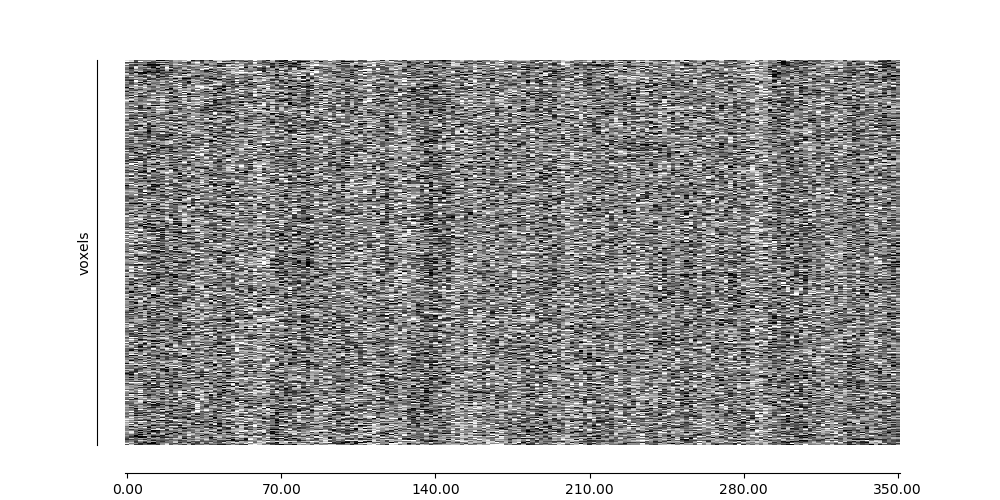
A common quality control step for functional MRI data is to visualize the data over time in a carpet plot (also known as a Power plot or a grayplot).
The nilearn.plotting.plot_carpet function generates a carpet plot from a 4D functional image.
9.2.3.1. Fetching data from ADHD dataset
from nilearn import datasets

adhd_dataset = datasets.fetch_adhd(n_subjects=1)

# Print basic information on the dataset
print('First subject functional nifti image (4D) is at: %s' %
      adhd_dataset.func[0])  # 4D data
Out:
/home/varoquau/dev/nilearn/nilearn/datasets/func.py:438: VisibleDeprecationWarning: Reading unicode strings without specifying the encoding argument is deprecated. Set the encoding, use None for the system default.
  phenotypic = np.genfromtxt(phenotypic, names=True, delimiter=',',
First subject functional nifti image (4D) is at: /home/varoquau/nilearn_data/adhd/data/0010042/0010042_rest_tshift_RPI_voreg_mni.nii.gz
9.2.3.2. Deriving a mask
from nilearn import masking

# Build an EPI-based mask because we have no anatomical data
mask_img = masking.compute_epi_mask(adhd_dataset.func[0])
9.2.3.3. Visualizing global patterns over time
import matplotlib.pyplot as plt

from nilearn.plotting import plot_carpet

display = plot_carpet(adhd_dataset.func[0], mask_img)

display.show()

Out:
/home/varoquau/dev/nilearn/examples/01_plotting/plot_carpet.py:40: UserWarning: Matplotlib is currently using agg, which is a non-GUI backend, so cannot show the figure.
  display.show()
Total running time of the script: ( 0 minutes 4.033 seconds)
