Note
Click here to download the full example code or to run this example in your browser via Binder
9.2.1. Basic Atlas plotting
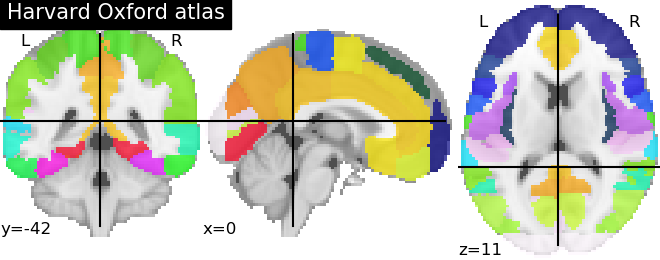
Plot the regions of a reference atlas (here the Harvard-Oxford atlas).
9.2.1.1. Retrieving the atlas data
from nilearn import datasets

dataset = datasets.fetch_atlas_harvard_oxford('cort-maxprob-thr25-2mm')
atlas_filename = dataset.maps

print('Atlas ROIs are located at: %s' % atlas_filename)
Out:
Atlas ROIs are located at: /home/varoquau/nilearn_data/fsl/data/atlases/HarvardOxford/HarvardOxford-cort-maxprob-thr25-2mm.nii.gz
9.2.1.2. Visualizing the Harvard-Oxford atlas
from nilearn import plotting

plotting.plot_roi(atlas_filename, title="Harvard Oxford atlas")

Out:
<nilearn.plotting.displays.OrthoSlicer object at 0x7f8bfc69d5e0>
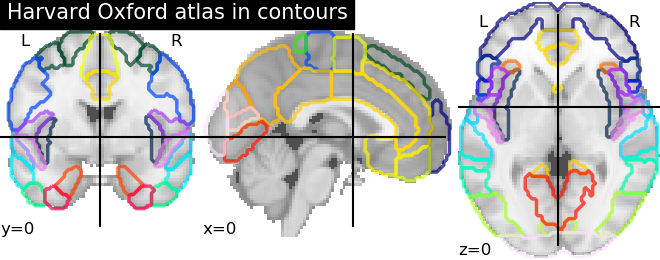
9.2.1.3. Visualizing the Harvard-Oxford atlas with contours
plotting.plot_roi(atlas_filename, view_type='contours',
                  title="Harvard Oxford atlas in contours")
plotting.show()

Out:
/home/varoquau/dev/nilearn/nilearn/plotting/displays.py:97: UserWarning: No contour levels were found within the data range.
  im = getattr(ax, type)(data_2d.copy(),
Total running time of the script: ( 0 minutes 8.513 seconds)
