Note
This page is a reference documentation. It only explains the function signature, and not how to use it. Please refer to the user guide for the big picture.
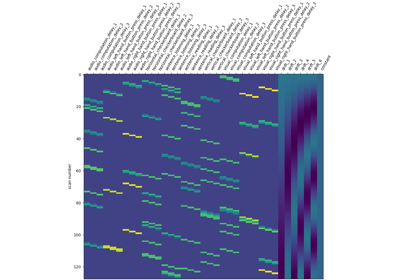
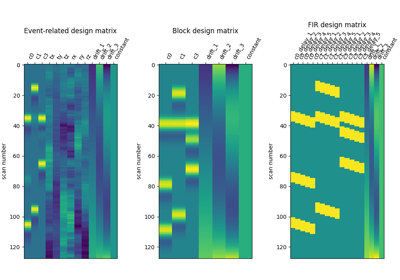
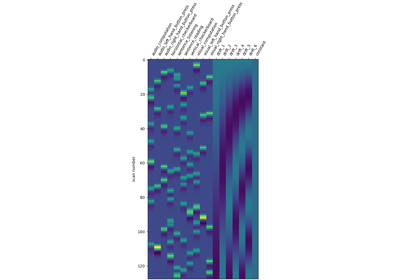
nilearn.plotting.plot_design_matrix
- nilearn.plotting.plot_design_matrix(design_matrix, rescale=True, axes=None, output_file=None)[source]
Plot a design matrix provided as a
pandas.DataFrame.- Parameters:
- design matrix
pandas.DataFrame Describes a design matrix.
- rescale
bool, default=True Rescale columns magnitude for visualization or not.
- axes
matplotlib.axes.Axesor None, default=None Handle to axes onto which we will draw the design matrix.
- output_file
str, or None, optional The name of an image file to export the plot to. Valid extensions are .png, .pdf, .svg. If output_file is not None, the plot is saved to a file, and the display is closed.
- design matrix
- Returns:
- axes
matplotlib.axes.Axes The axes used for plotting.
- axes
Examples using nilearn.plotting.plot_design_matrix
Intro to GLM Analysis: a single-run, single-subject fMRI dataset
Analysis of an fMRI dataset with a Finite Impule Response (FIR) model
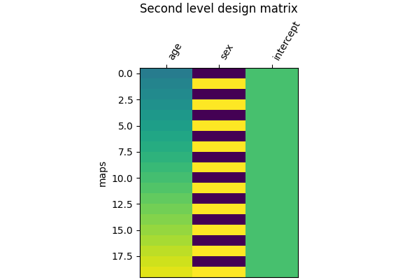
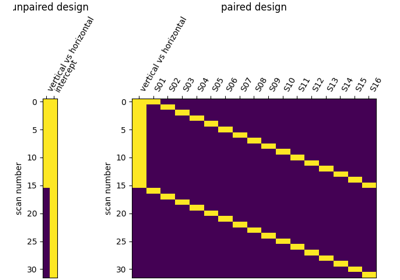
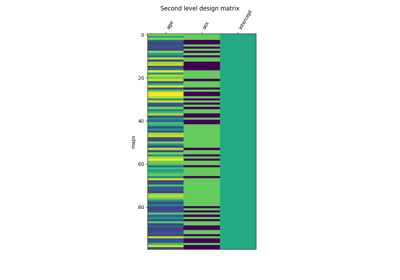
Second-level fMRI model: two-sample test, unpaired and paired
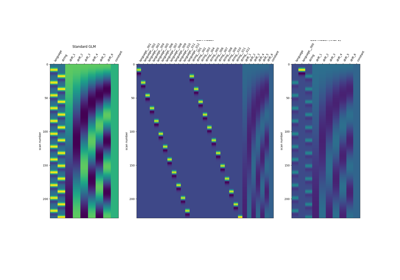
Beta-Series Modeling for Task-Based Functional Connectivity and Decoding