Note
Go to the end to download the full example code or to run this example in your browser via Binder
Controlling the contrast of the background when plotting#
The dim argument controls the contrast of the background.
dim modifies the contrast of this image: dim=0 leaves the image unchanged, negative values of dim enhance it, and positive values decrease it (dim the background).
This dim argument may also be useful for the plot_roi function used to display ROIs on top of a background image.
Retrieve the data: the localizer dataset with contrast maps#
from nilearn import datasets

localizer_dataset = datasets.fetch_localizer_button_task(legacy_format=False)
# Contrast map of motor task
localizer_tmap_filename = localizer_dataset.tmap
# Subject specific anatomical image
localizer_anat_filename = localizer_dataset.anat
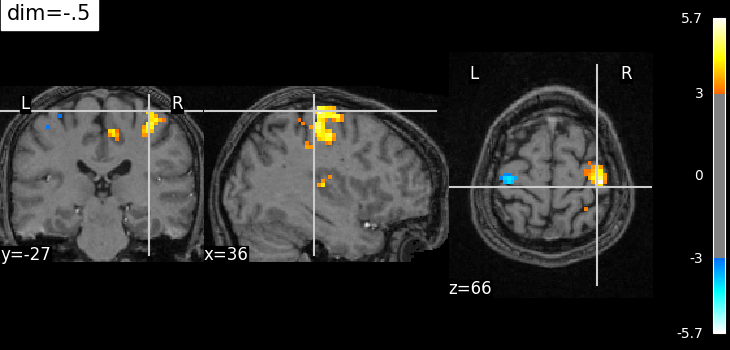
Plotting with enhancement of background image with dim=-.5#
from nilearn import plotting

plotting.plot_stat_map(
    localizer_tmap_filename,
    bg_img=localizer_anat_filename,
    cut_coords=(36, -27, 66),
    threshold=3,
    title="dim=-.5",
    dim=-0.5,
)
<nilearn.plotting.displays._slicers.OrthoSlicer object at 0x7fb3bc974f90>
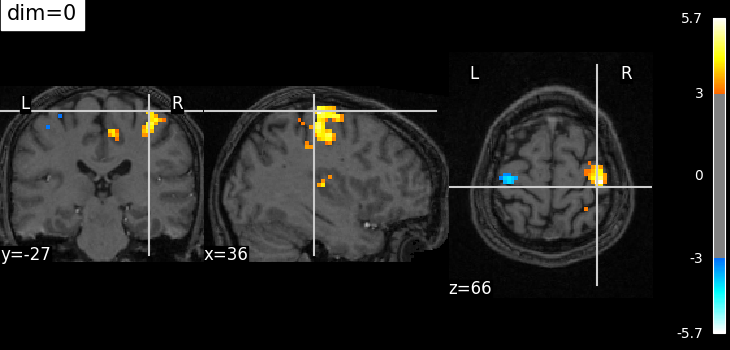
Plotting with no change of contrast in background image with dim=0#
plotting.plot_stat_map(
    localizer_tmap_filename,
    bg_img=localizer_anat_filename,
    cut_coords=(36, -27, 66),
    threshold=3,
    title="dim=0",
    dim=0,
)
<nilearn.plotting.displays._slicers.OrthoSlicer object at 0x7fb3b1468d10>
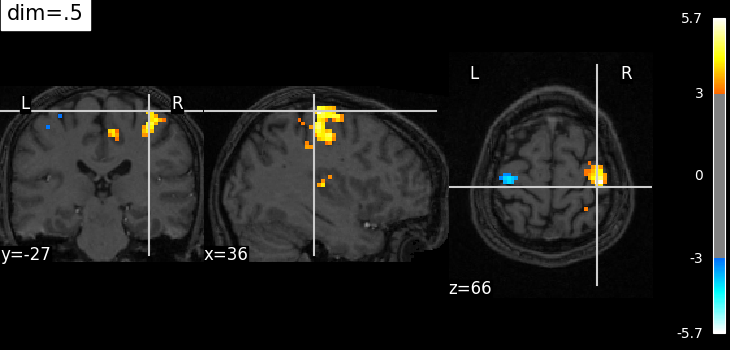
Plotting with decrease of contrast in background image with dim=.5#
plotting.plot_stat_map(
    localizer_tmap_filename,
    bg_img=localizer_anat_filename,
    cut_coords=(36, -27, 66),
    threshold=3,
    title="dim=.5",
    dim=0.5,
)
<nilearn.plotting.displays._slicers.OrthoSlicer object at 0x7fb3b150dad0>
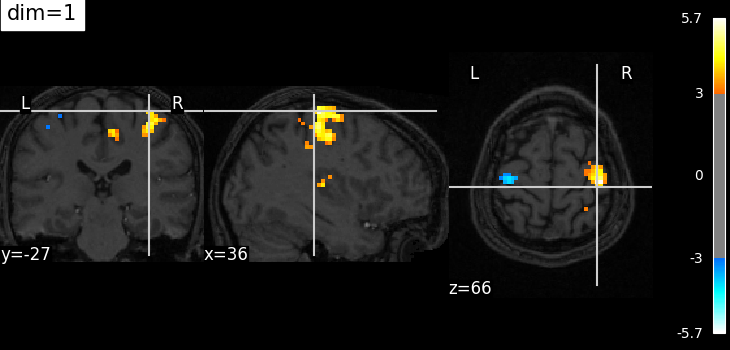
Plotting with more decrease in contrast with dim=1#
plotting.plot_stat_map(
    localizer_tmap_filename,
    bg_img=localizer_anat_filename,
    cut_coords=(36, -27, 66),
    threshold=3,
    title="dim=1",
    dim=1,
)

plotting.show()
Total running time of the script: (0 minutes 9.605 seconds)
Estimated memory usage: 9 MB